Bitcoin Technical Analysis January 26th
Bitcoin (BTC) has been on the rise since hitting a local low of $33,000 on Jan. 24. It is currently
Bitcoin (BTC) is showing strong bullish signals on the intraday but has yet to break its short-term horizontal resistance levels.
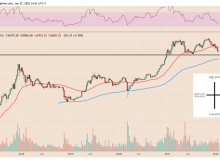
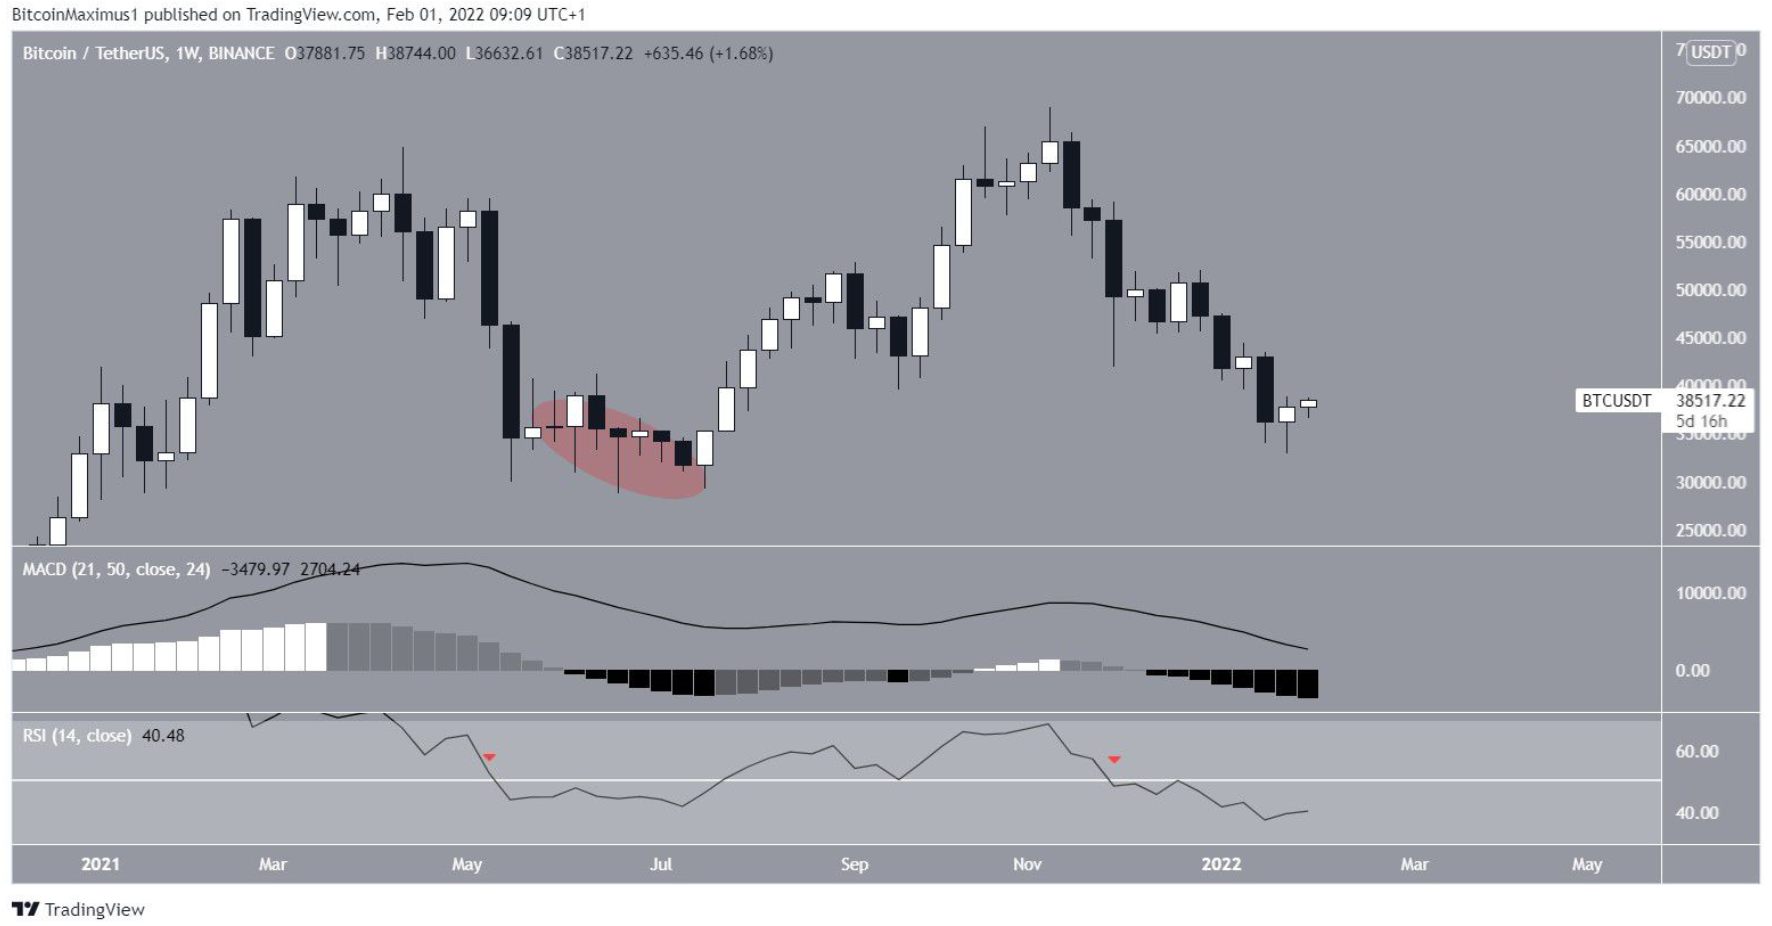
Bitcoin recovered slightly in the week of Jan. 23-30, creating a small bullish real body to fit in the previous week’s bearish candle.
Currently, both the RSI and the MACD are falling. The RSI, which is a momentum indicator, has fallen below 50 (red symbol). This is considered a sign of a downtrend. However, the last time the RSI dipped below this level, it made only one deviation (red circle) before resuming the uptrend.
Overall, the weekly timeframe shows a relatively bearish outlook.
BTC/USDT weekly chart | Source: TradingView
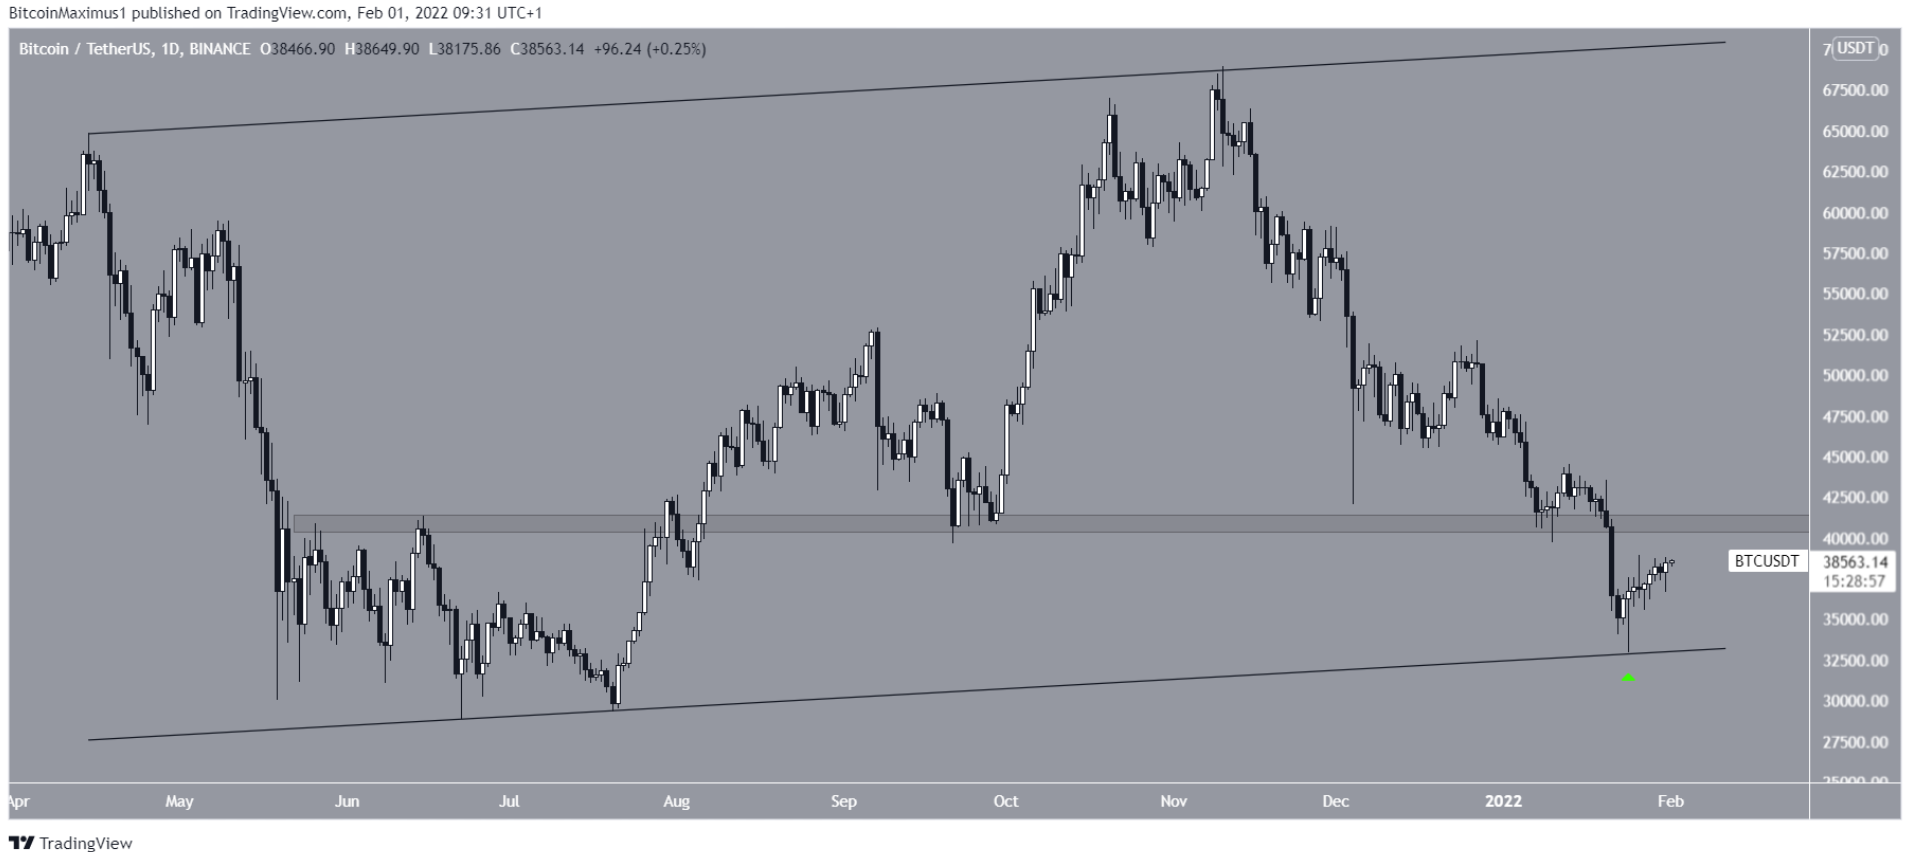
The daily chart shows BTC trading within an ascending parallel channel since April 13, 2021. Pressure. Since then, prices have gone up.
The next resistance is found at $40,800, a level that previously acted as support.
BTC/USDT daily chart | Source: TradingView
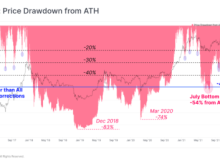
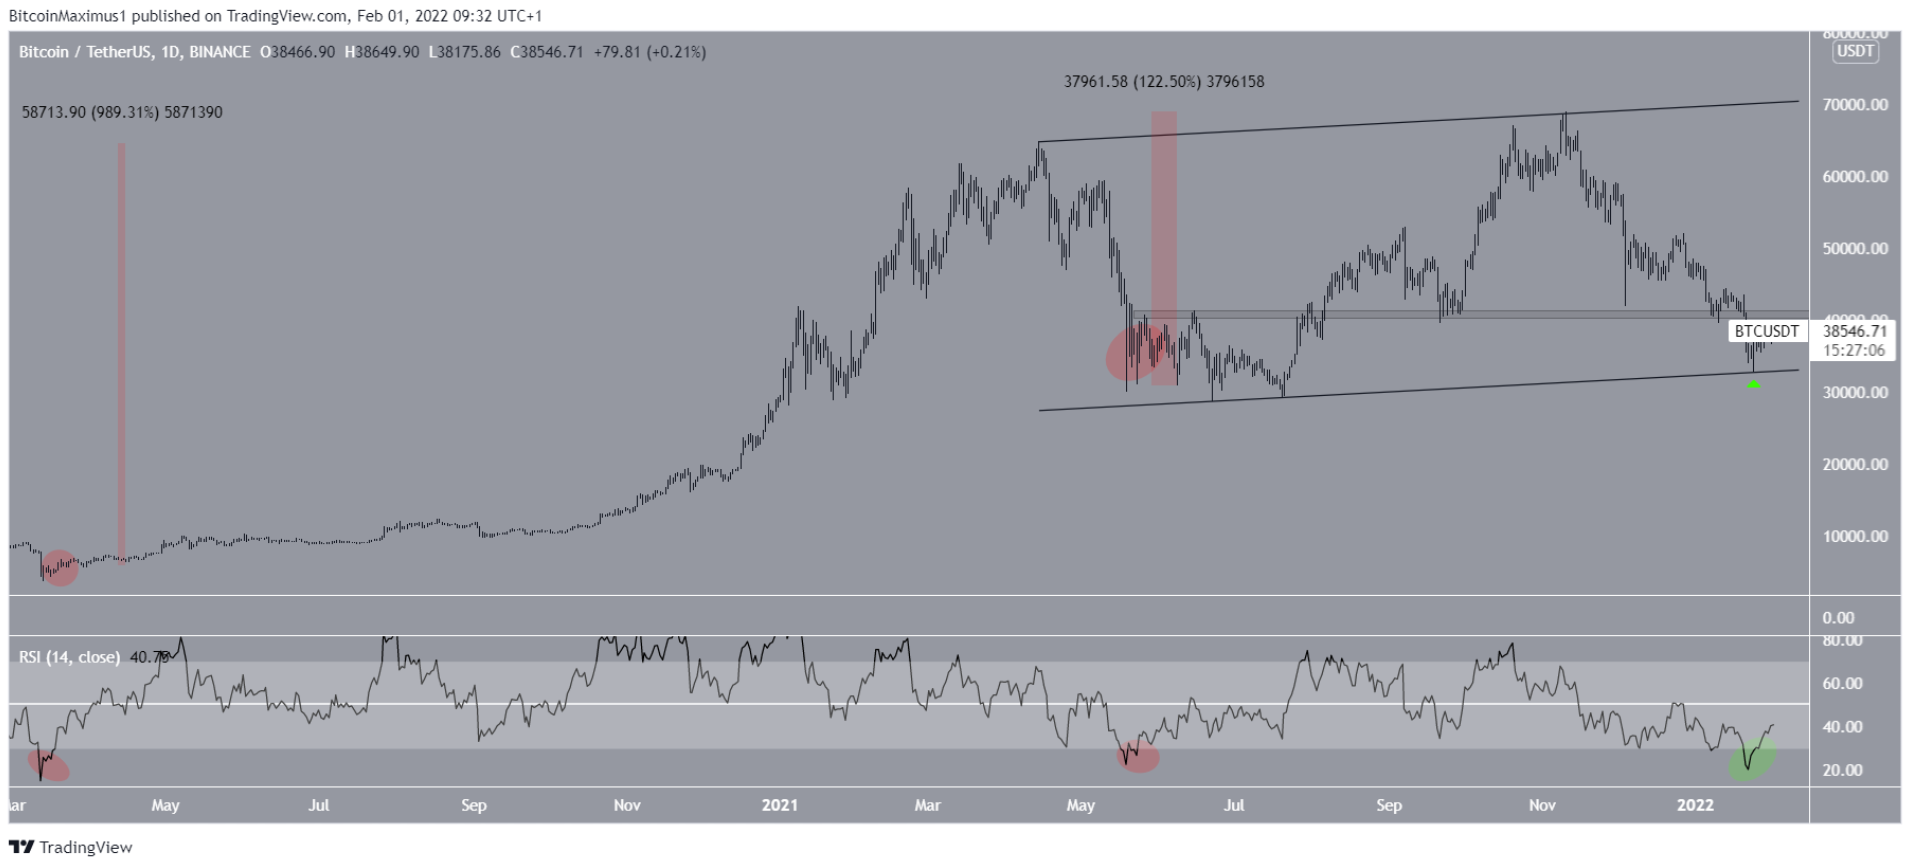
The daily RSI will give a bullish signal once it breaks above the 30 oversold level (green circle).
Previously, the RSI had dipped below 30 before regaining the level twice:
As such, this is a historically bullish sign and often signals that BTC has bottomed or is very close to a bottom.
BTC/USDT daily chart | Source: TradingView
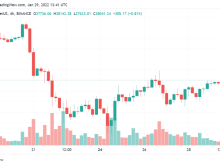
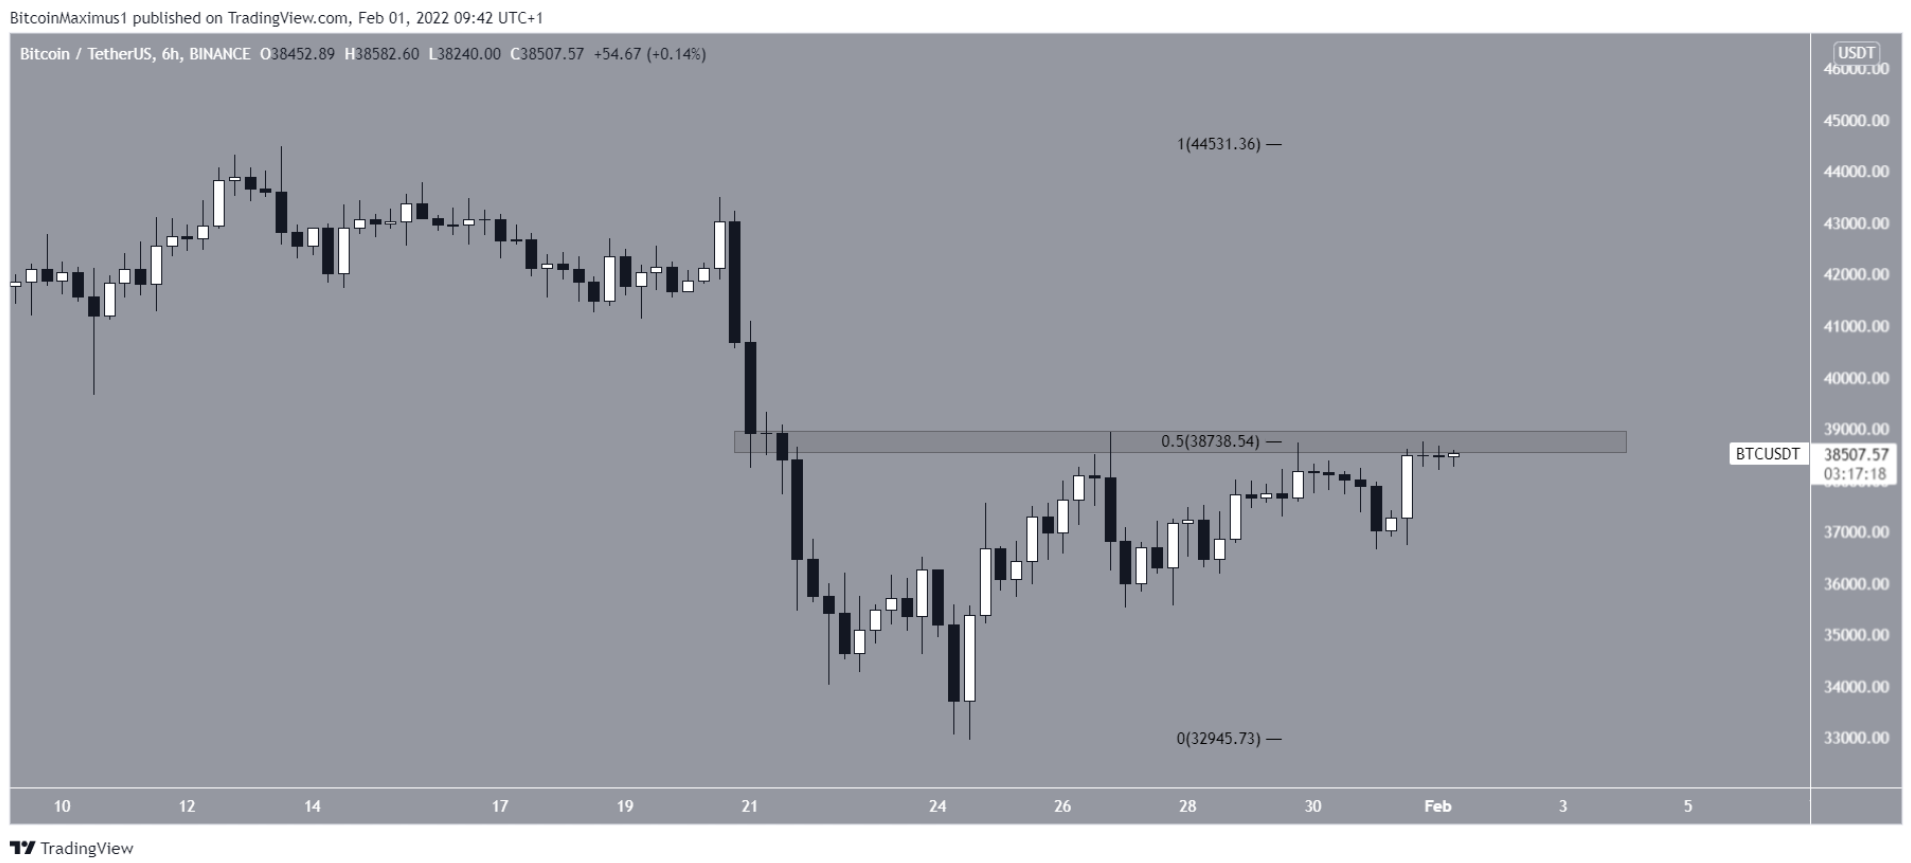
The six-hour chart shows BTC trading within a minor resistance of $38,700, which is both a horizontal resistance and a 0.5 Fib retracement resistance.
Previously, the price attempted a breakout on Jan. 27 and is currently attempting another breakout.
BTC/USDT 6 hour chart | Source: TradingView
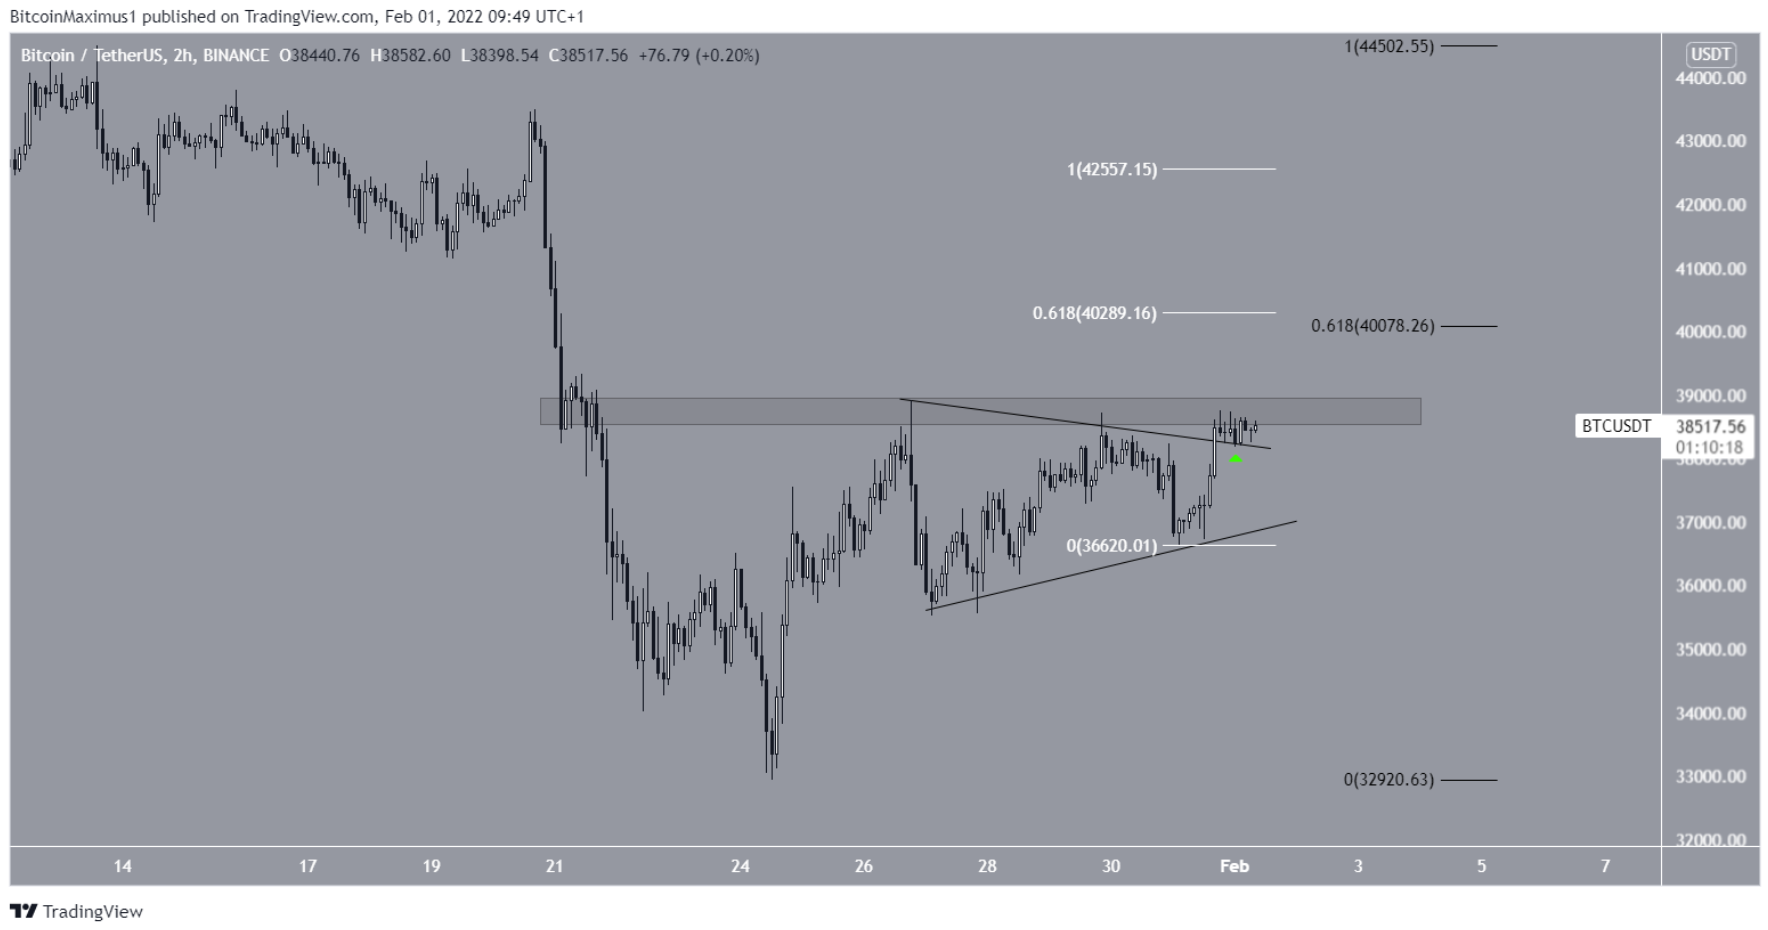
The two-hour chart shows that BTC has broken the symmetrical triangle (green symbol) and is in the process of confirming it as support.
If it manages to reclaim the $37,800 resistance area, the main target will be between $40,000 and $40,300. This target area is found using the 0.618 length of the previous up move (white) and the 0.618 Fib retracement resistance.
If BTC breaks this level, the next target will be found at $42,500.
BTC/USDT 2 hour chart | Source: TradingView
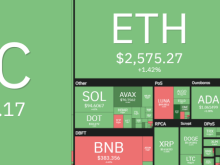
You can see the coin prices here.
Subscribe to Bitcoin Magazine Telegram to follow updates and comment on this article: https://t.me/coincunews
Disclaimer: This article is for informational purposes only, not investment advice. Investors should research carefully before making a decision. We are not responsible for your investment decisions.
SN_Nour
According to beincrypto