Bitcoin Technical Analysis January 26th
Bitcoin (BTC) has been on the rise since hitting a local low of $33,000 on Jan. 24. It is currently
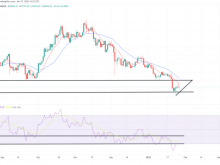
Bitcoin (BTC) has recovered to $38,919 since falling below this zone on Jan. 21. The price has since retreated somewhat but may have completed a short-term corrective structure.
Bitcoin has recovered and is rising after hitting a local low of $32,917 on Jan. 24. The upward move continued until BTC hit a high of $38,919 on Jan. 26. This was short-lived as BTC created a long upper wick and fell on the same day.
It failed to move above the $38,200 resistance, which is both the 0.5 Fib retracement level and the horizontal resistance area.
BTC needs to retrace this zone to create a short-term bullish structure.
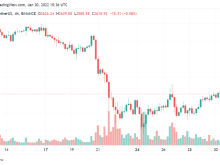
BTC/USDT 2 hour chart | Source: TradingView
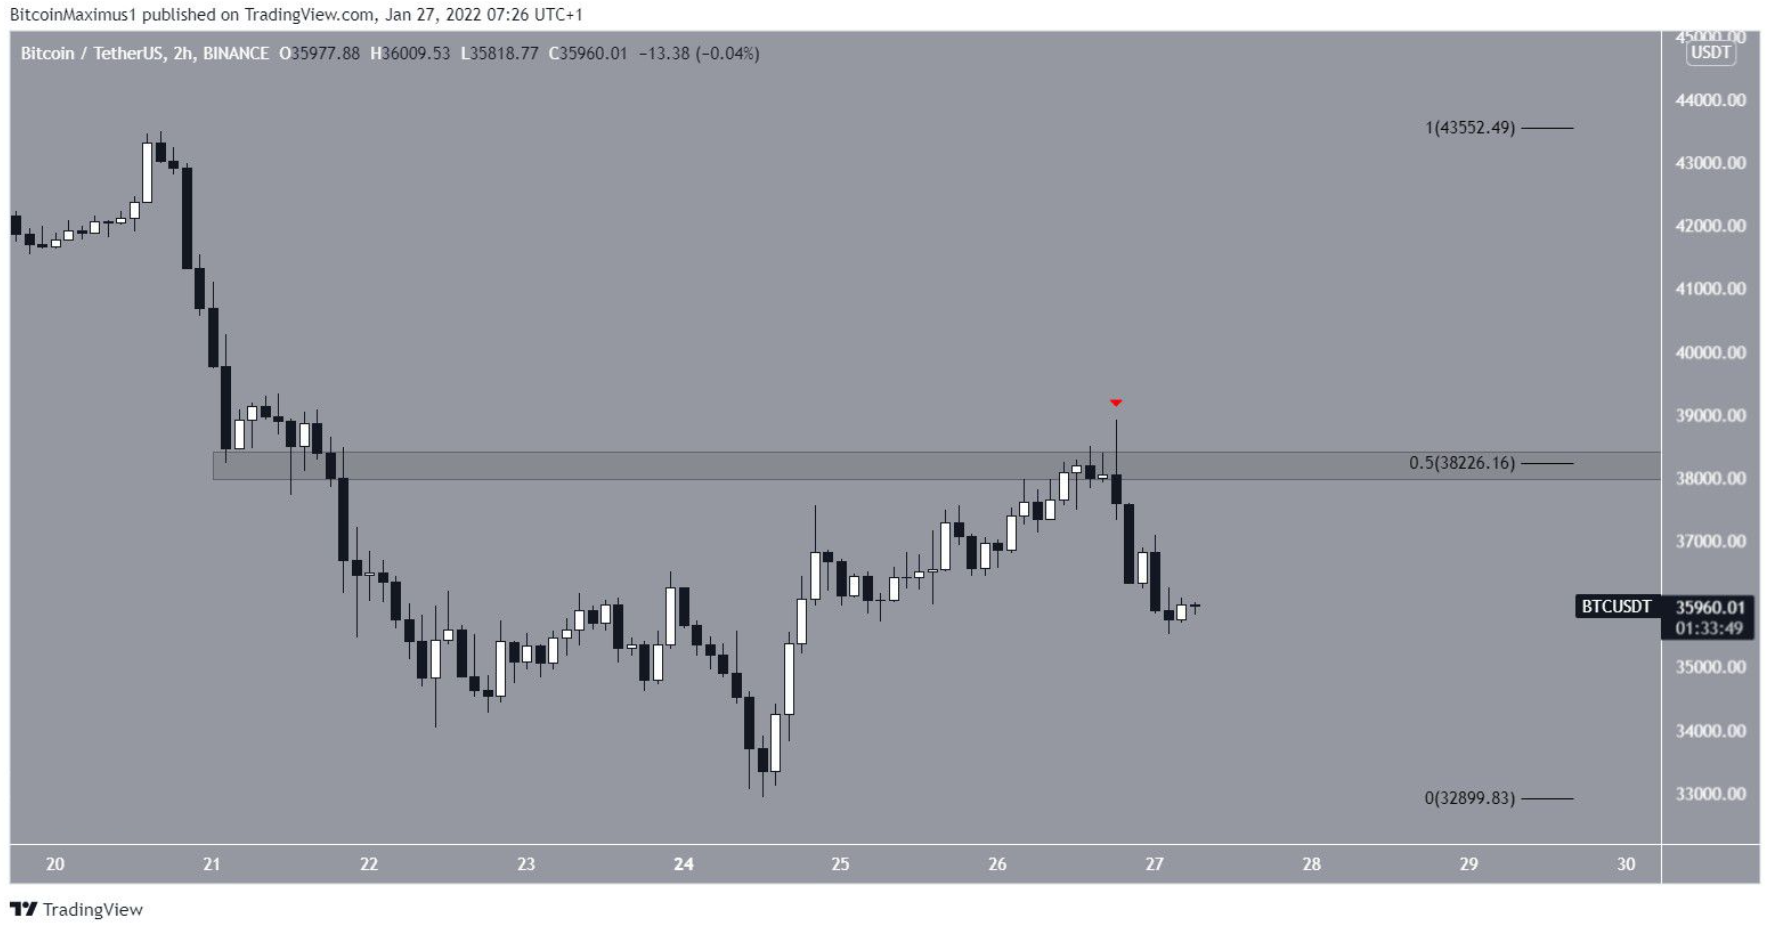
The daily chart shows that the price created a long upper wick on January 26th, which is considered a sign of selling pressure.
However, it is currently approaching the lower Longwick territory created on January 24 to provide support.
BTC/USDT daily chart | Source: TradingView
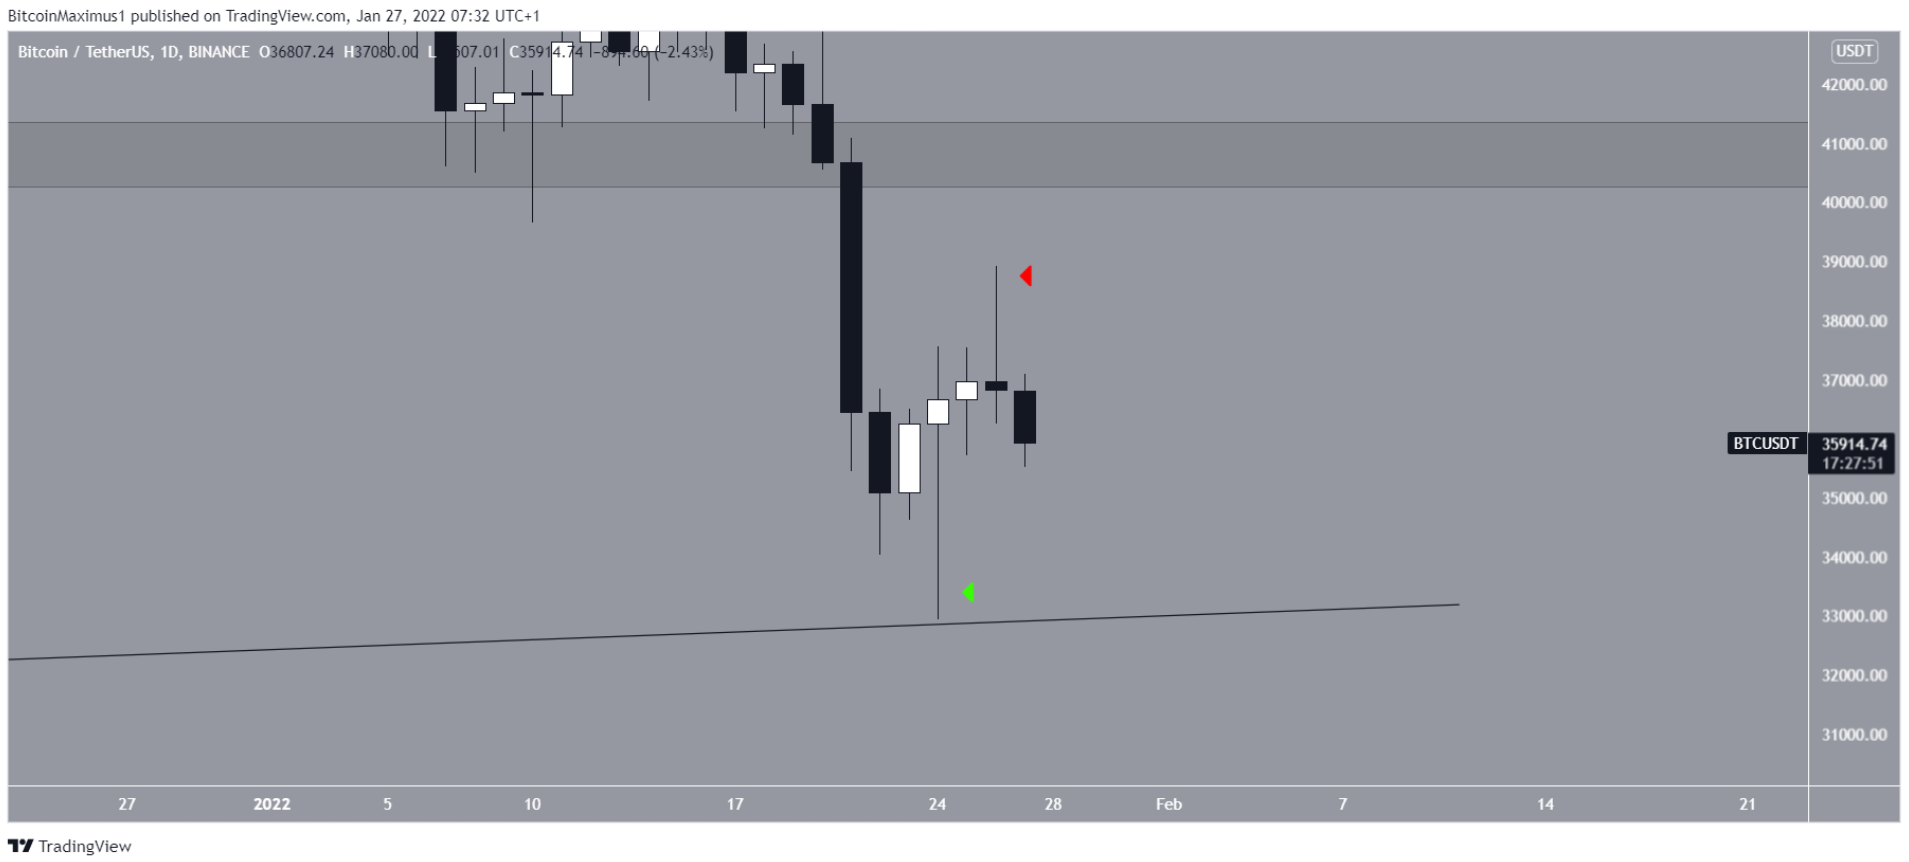
Additionally, looking at the two-hour chart, BTC is trading within the 0.5-0.618 Fib retracement support area between $35,200 and $35,900.
This is the most common Fib area that offers support after a sharp decline so it could start a reversal, which could make BTC make a higher low in the process.
BTC/USDT 2 hour chart | Source: TradingView
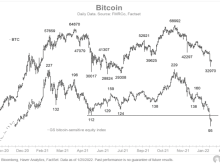
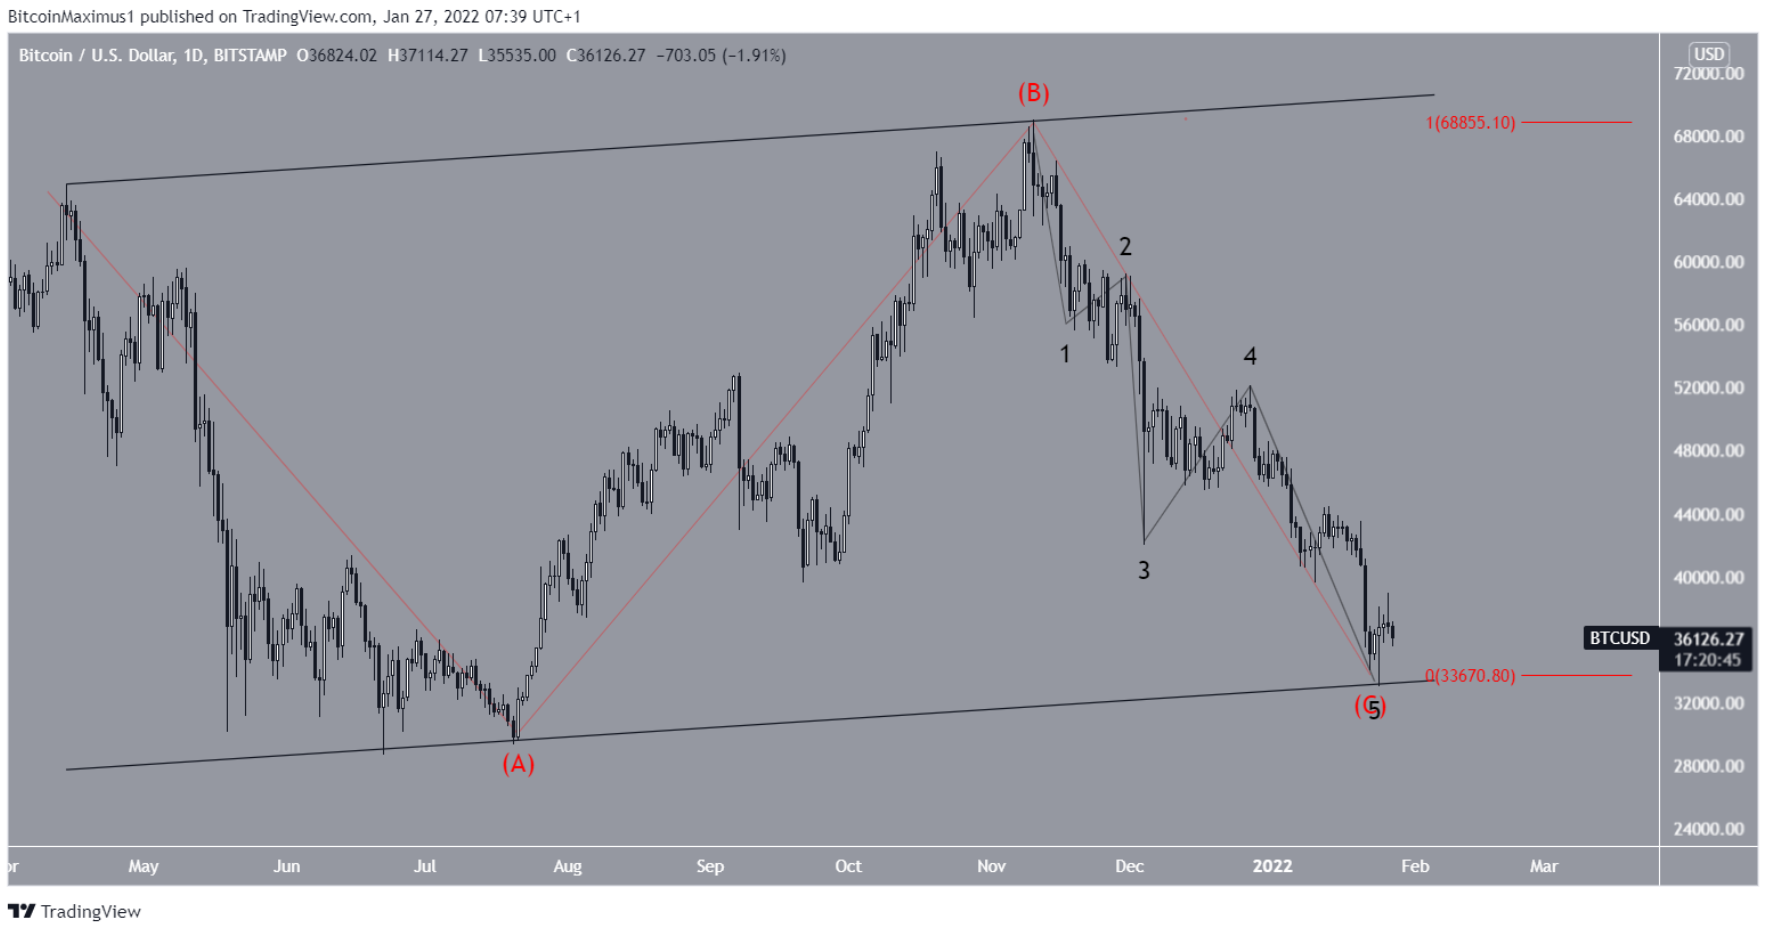
Long term wave count shows that BTC has completed a major ABC correction contained within an ascending parallel channel.
In it, waves A and C have an exact ratio of 1:1, indicating that BTC bottomed on Jan. 24.
BTC/USDT daily chart | Source: TradingView
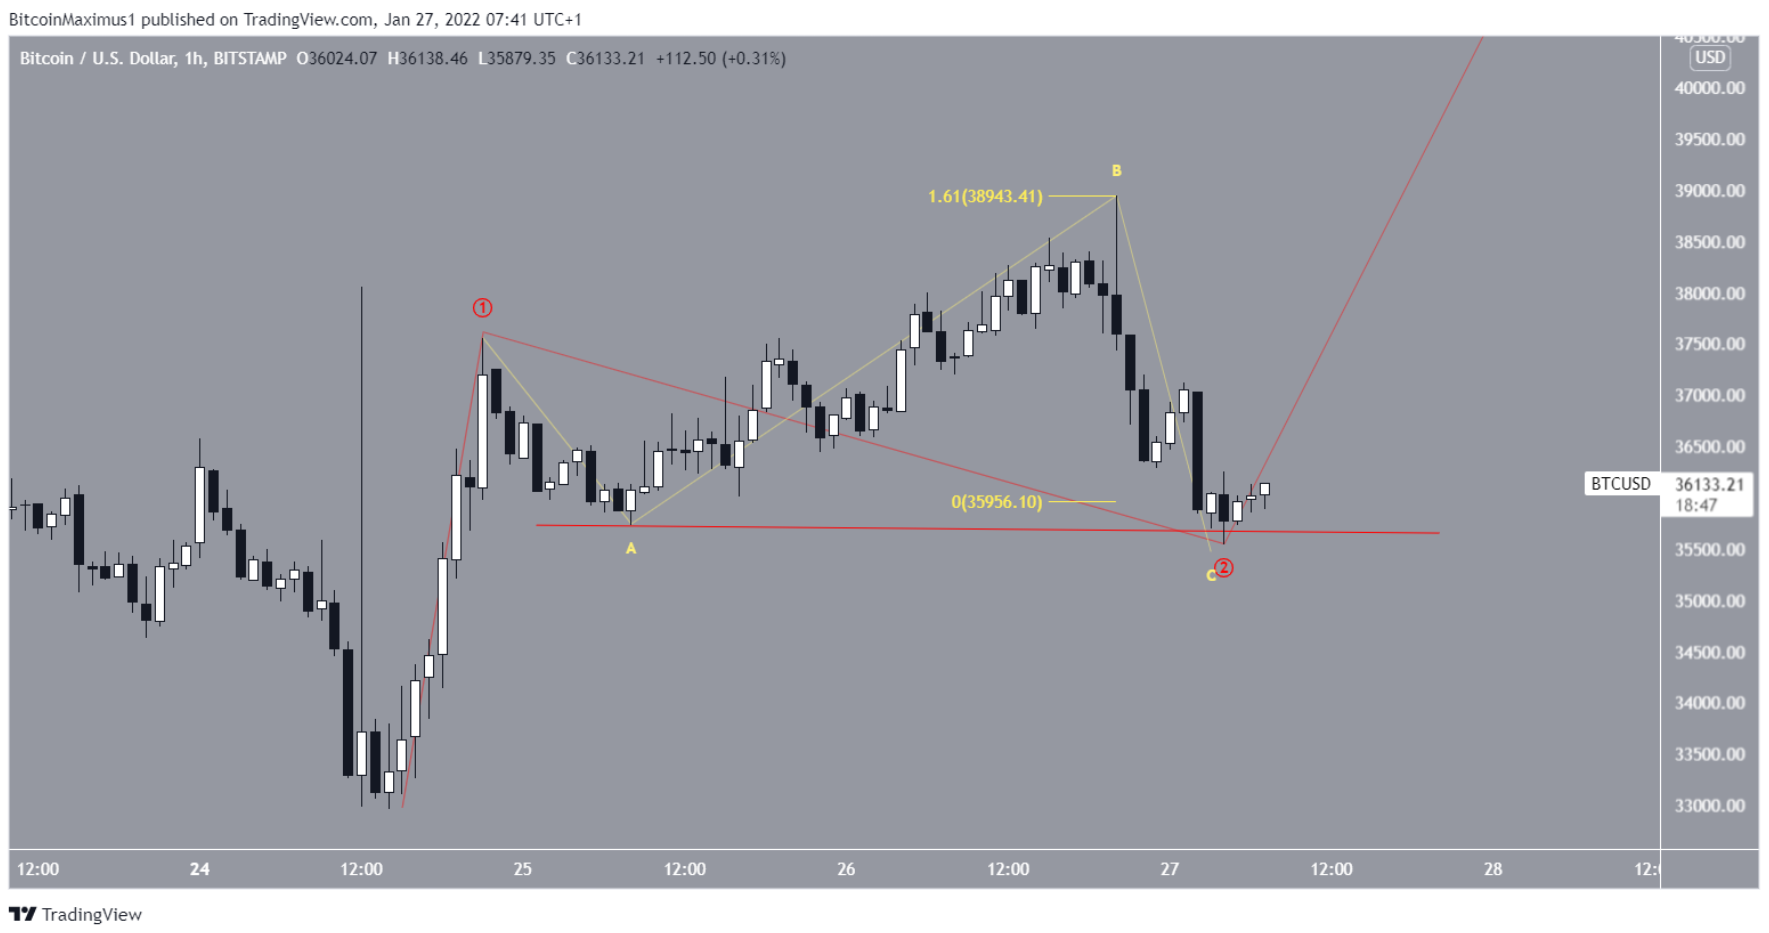
If true, the short-term wave count shows that BTC has completed sub-waves one and two (red). In it, the entire movement since January 26th has taken the form of an irregular flat (yellow) corrective structure.
The component waves A and C in this structure have a ratio of 1:1.61, which is the second most common in such structures.
Hourly BTC/USDT chart | Source: TradingView
You can see the bitcoin price here.
Join Bitcoin Magazine Telegram to follow news and comment on this article: https://t.me/coincunews
Disclaimer: This article is for informational purposes only, not investment advice. Investors should research carefully before making a decision. We are not responsible for your investment decisions.
SN_Nour
According to beincrypto