Bitcoin Technical Analysis February 2nd
Bitcoin (BTC) has been on the rise since Jan. 24 and has now reached the long-term descending resistance
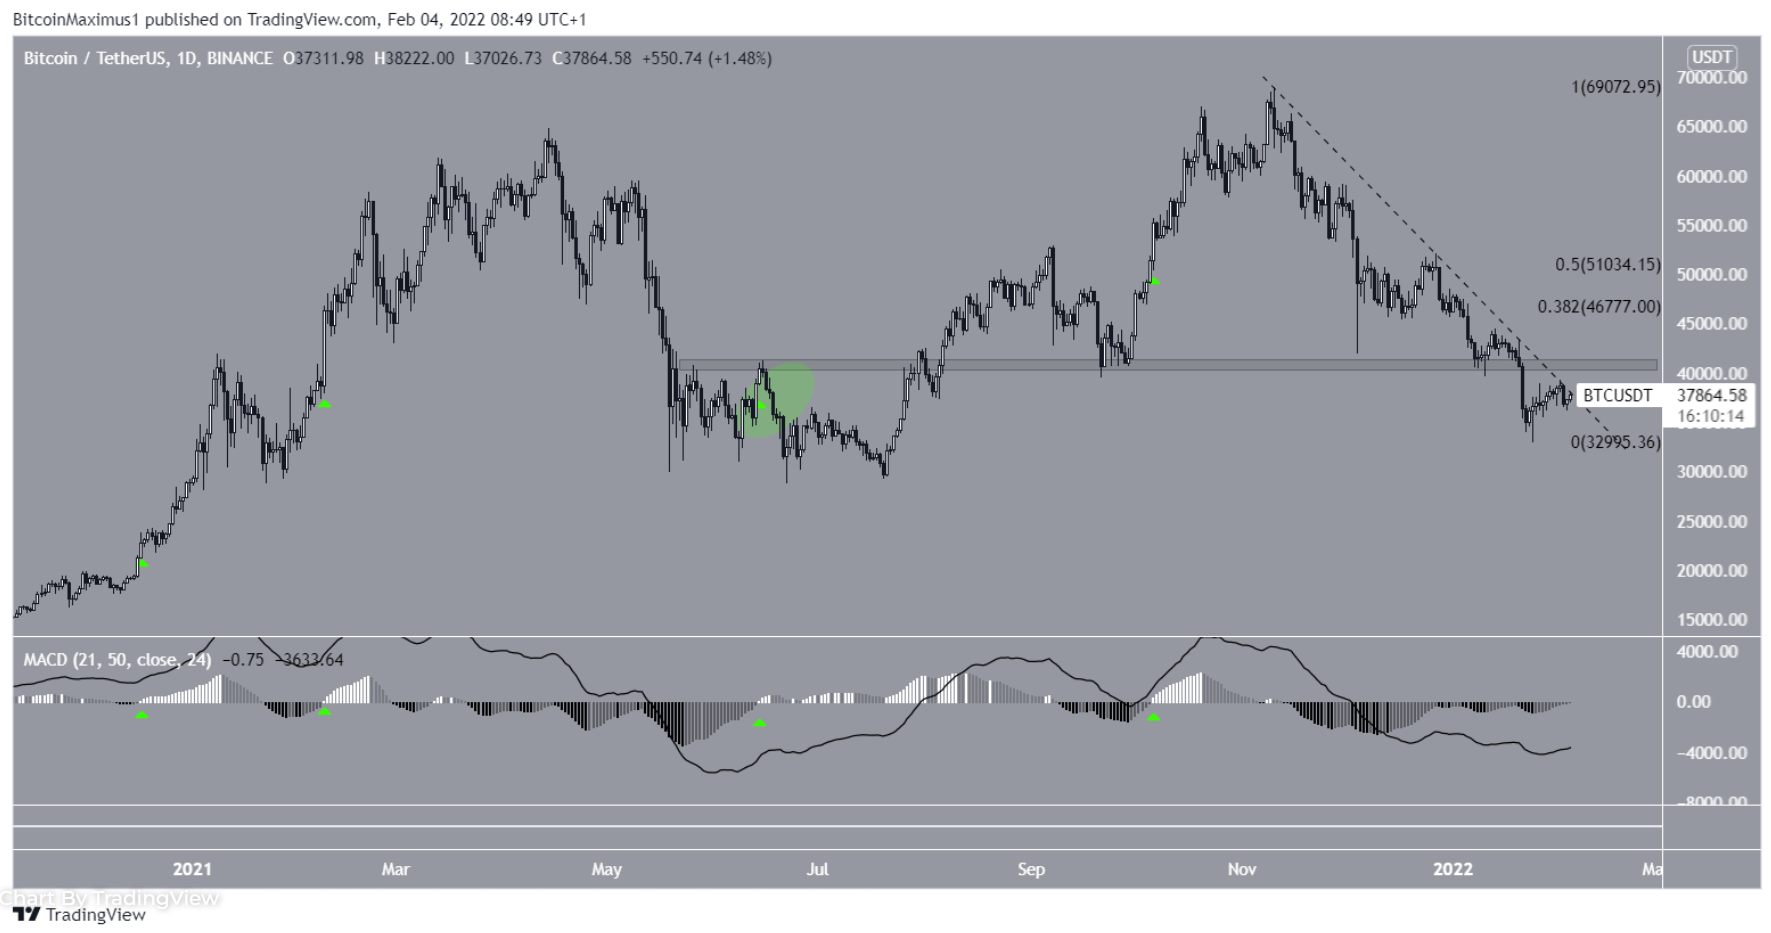
Bitcoin (BTC) has been moving higher since Jan. 24 and made its fourth attempt to break the descending resistance line on Feb. 4. The price is expected to break above this resistance.
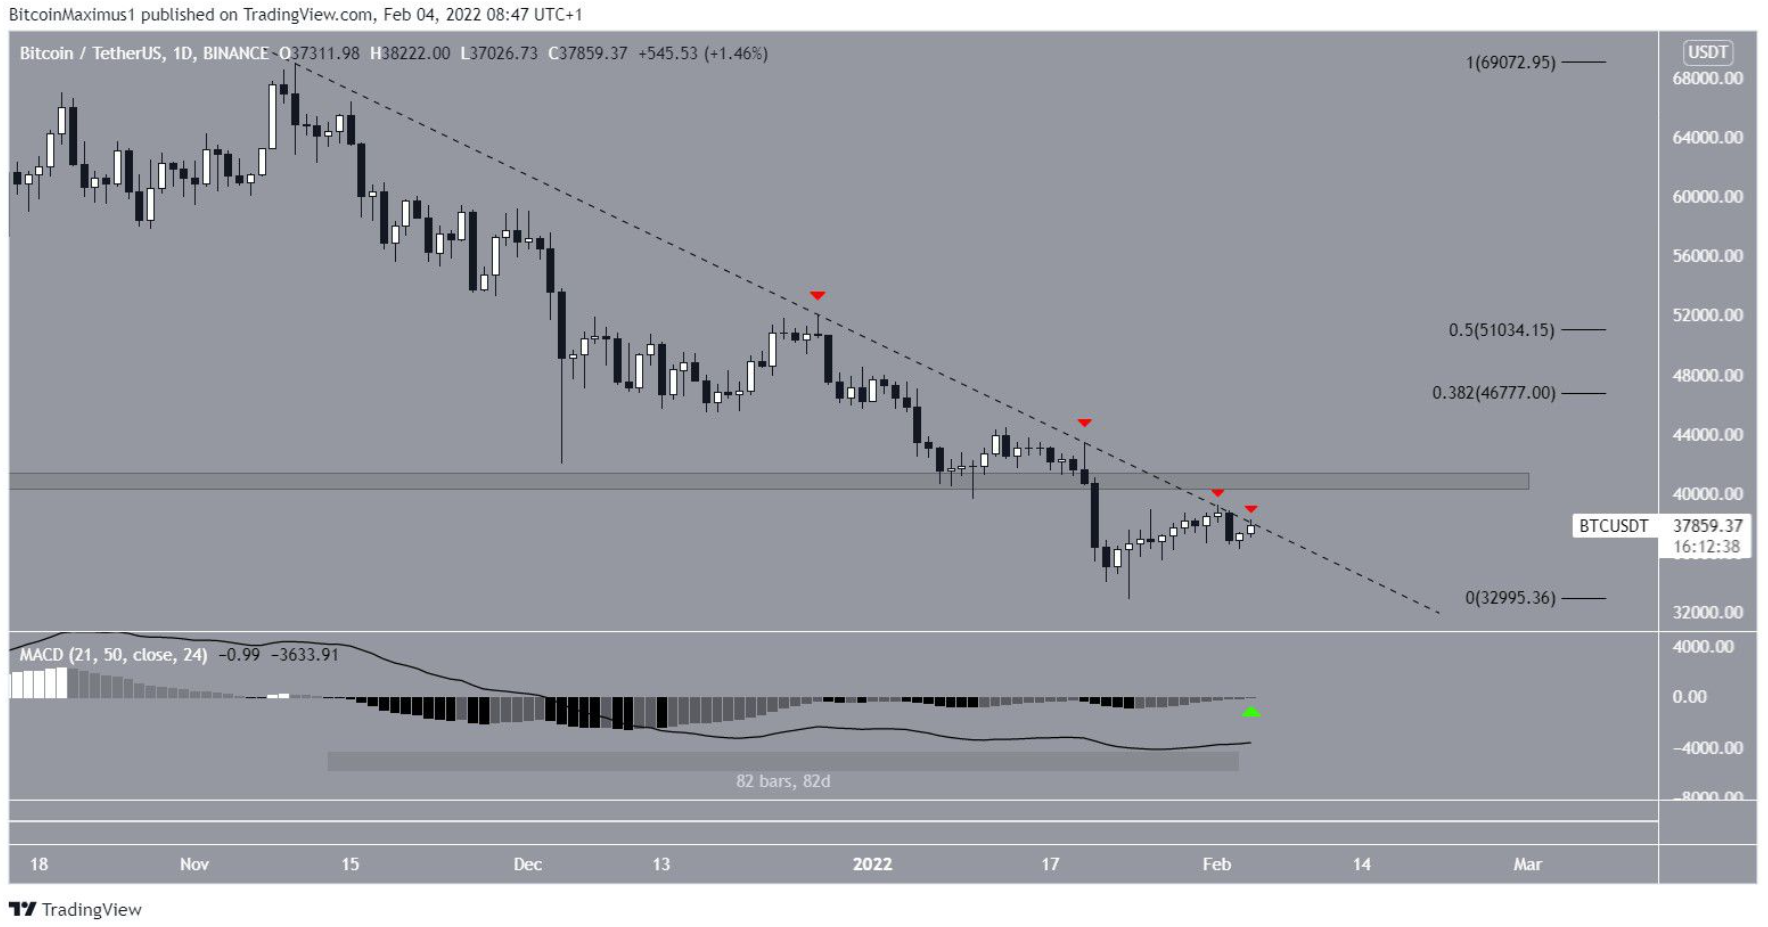
Bitcoin has fallen below the descending resistance line since hitting an all-time high on Nov. 10. The line has rejected the price (red icon) four times, most recently on February 4th. However, as resistance levels weaken each time they are touched, a final breakout above this line is expected.
The next horizontal resistance area is $40,800. If BTC manages to break above it, there will be resistance at $46,800 and $51,000. These are the 0.382 and 0.5 Fib retracement resistance levels, respectively.
A key bullish signal may soon appear in the MACD, which is an indicator formed by the short-term and long-term moving averages (MAs). After 82 days in negative territory, the MACD is very close to moving above positive territory. This means that the short-term MA moves faster than the long-term MA and is a key element of an uptrend.
BTC/USDT daily chart | Source: TradingView
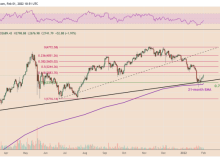
History shows that when the MACD moves into positive territory, significant upward moves often follow (green icon). This has happened four times since December 2020.
In June 2021, the first signal led to a short-term decline, but BTC rallied sharply shortly after.
BTC/USDT daily chart | Source: TradingView
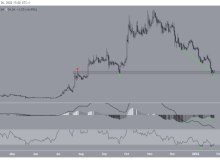
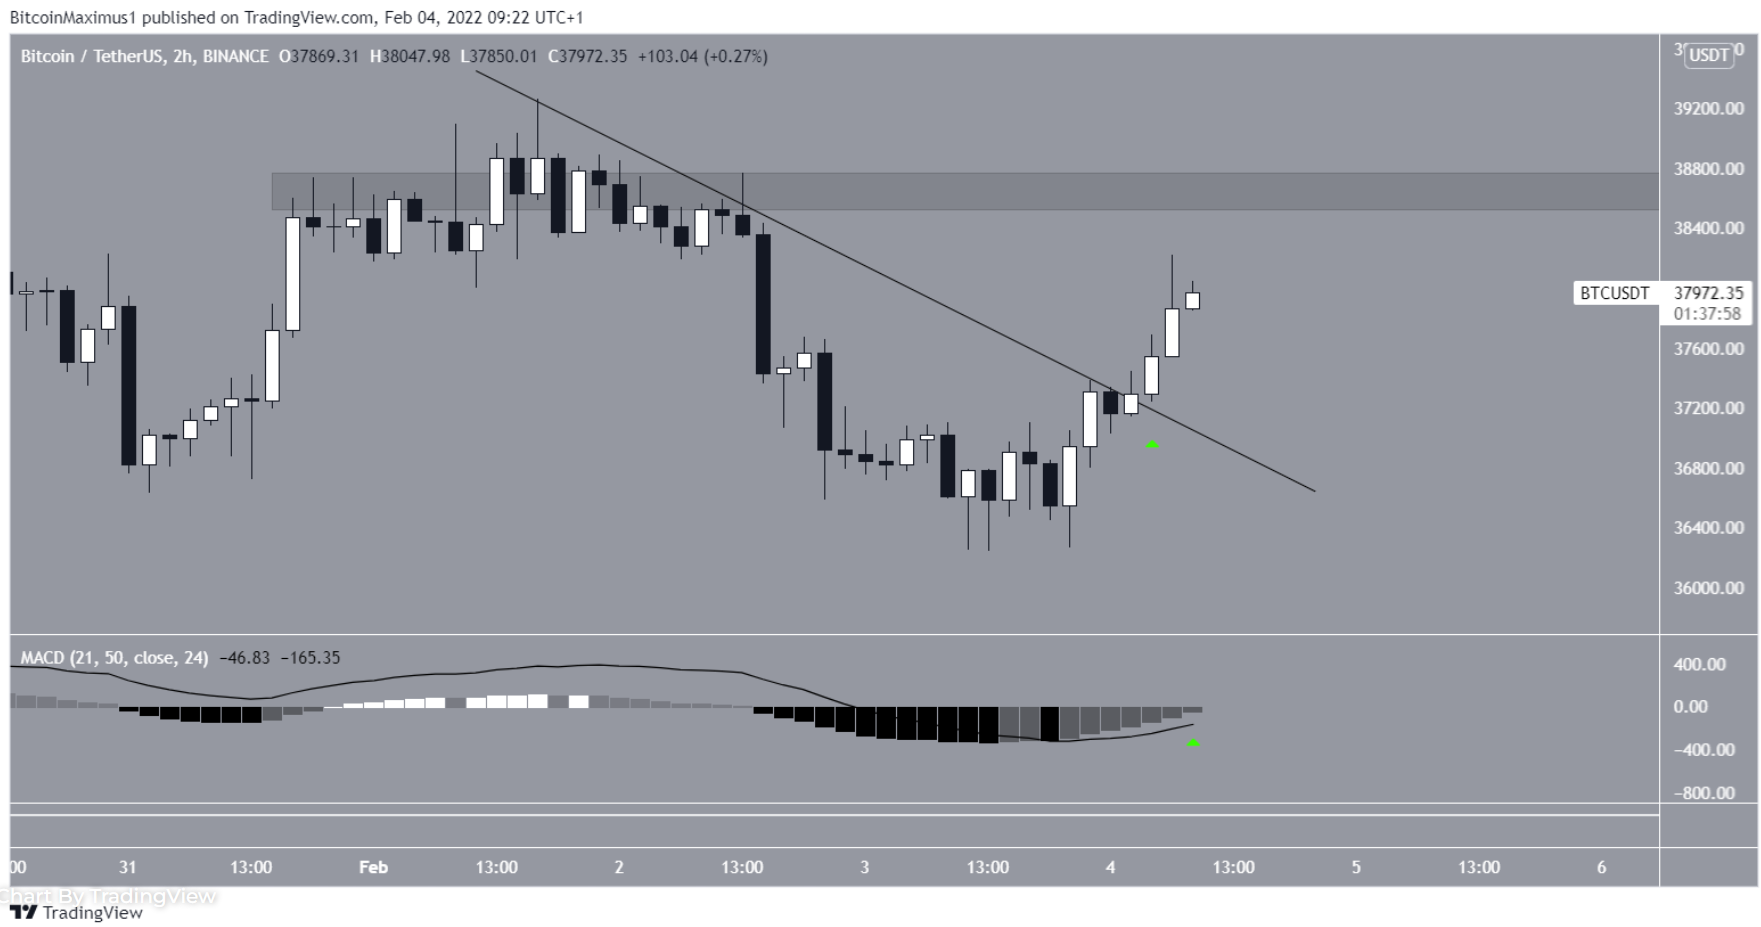
Looking at the two-hour chart, BTC broke above the short-term descending resistance line. Also, the MACD has almost entered positive territory.
The next resistance is at $38,650. A break above this level will also trigger a break above the long-term descending resistance line and potentially trigger some quick bullish momentum.
BTC/USDT 2 hour chart | Source: TradingView
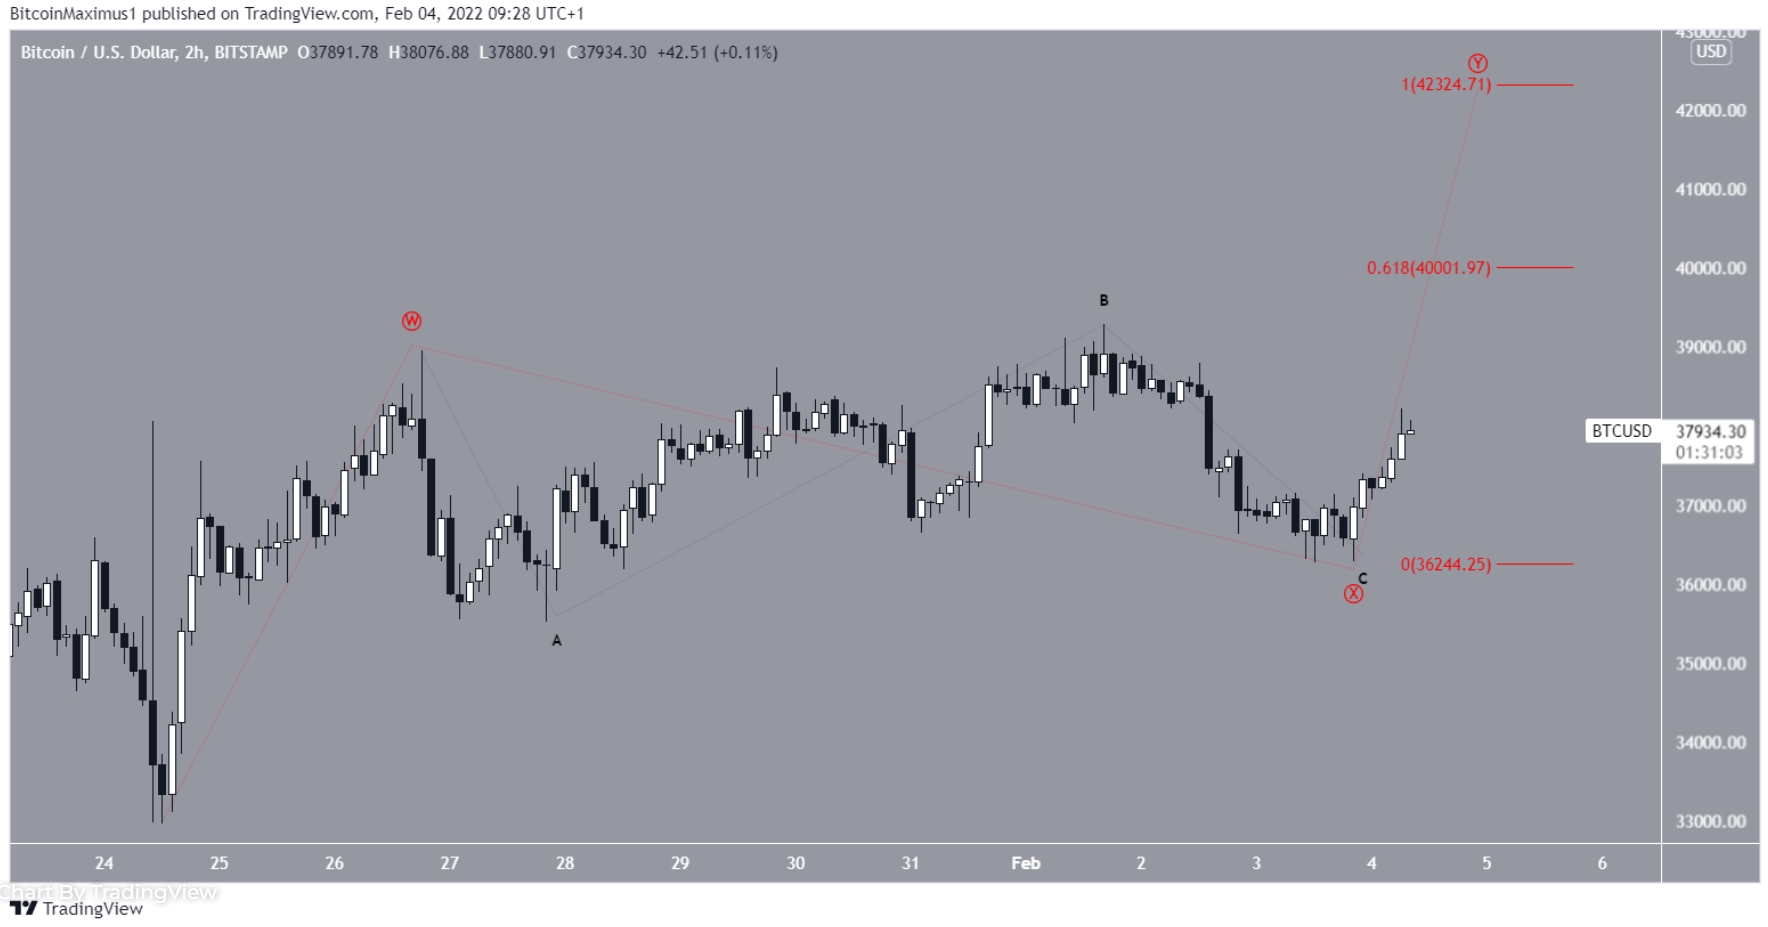
There are two main possibilities for the short-term wave count, both of which indicate that a strong rally is expected in the short-term.
The first is that BTC is in wave Y of the WXY corrective structure. The first potential target for the top of this move would be $40,000, giving waves W and Y a ratio of 1:0.618. The next target is $42,300 for the above 1:1 ratio waves.
BTC/USDT 2 hour chart | Source: TradingView
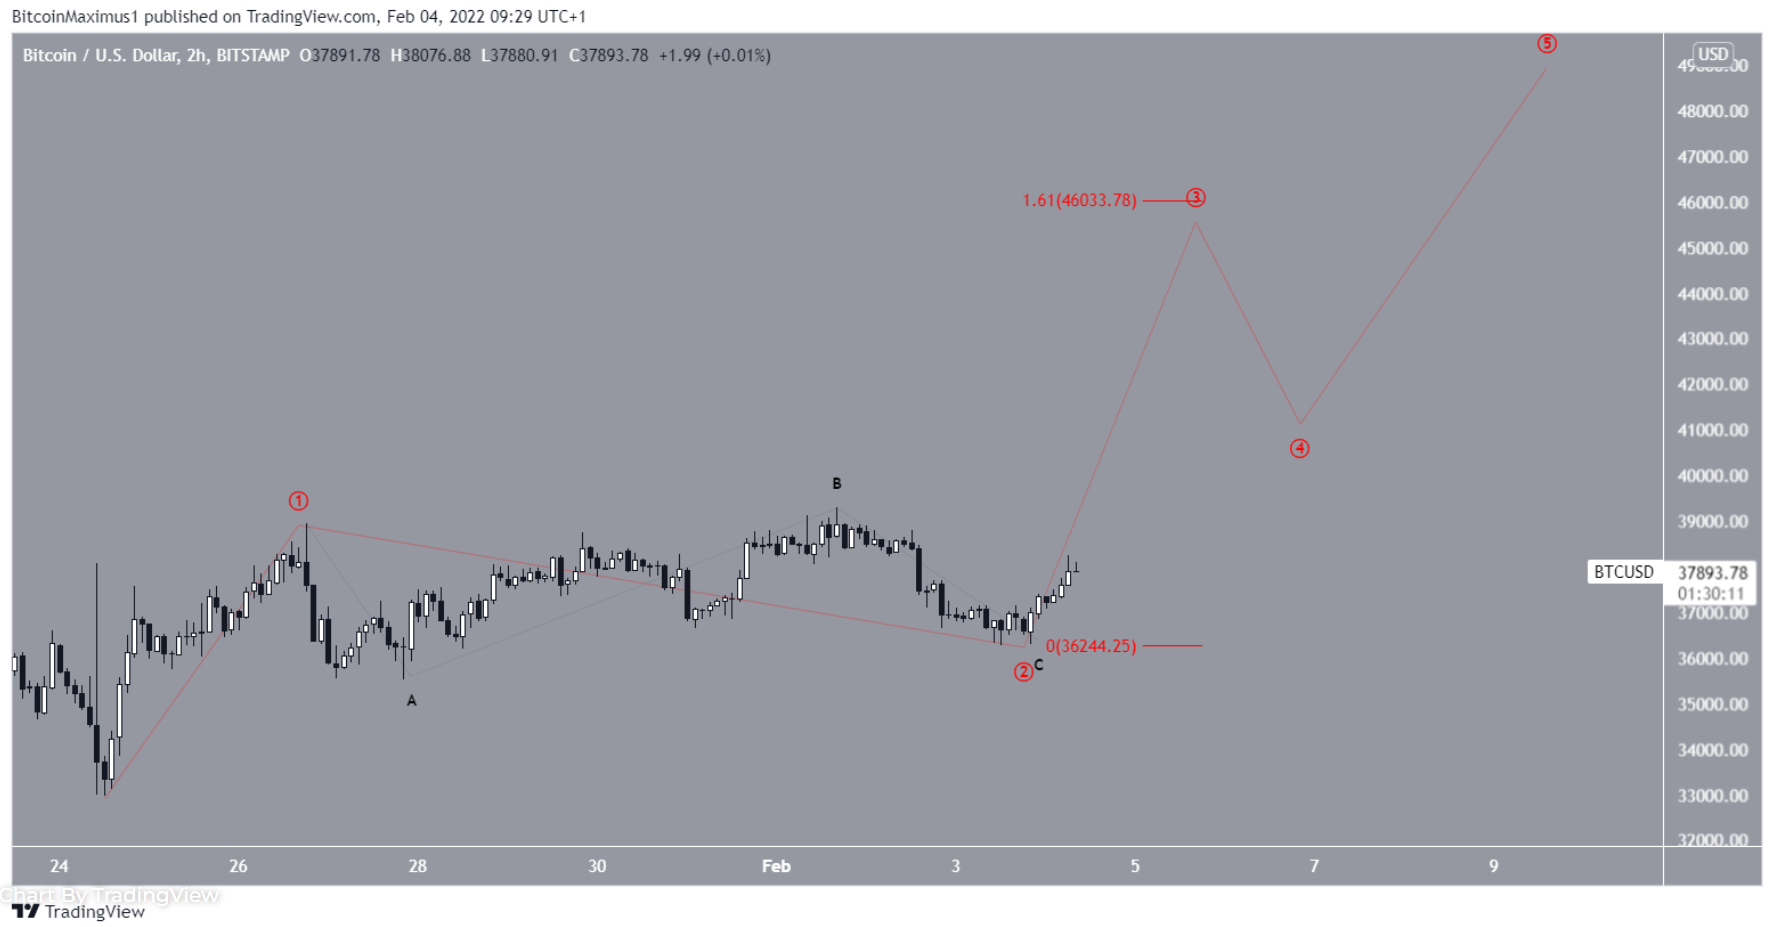
The most likely long-term wave count shows that BTC has bottomed. This means that the ongoing uptrend is part of a bullish impulse rather than a corrective phase.
The closer BTC gets to the 1.61 Fib level at $46,000, the more likely that number of waves will be.
BTC/USDT 2 hour chart | Source: TradingView
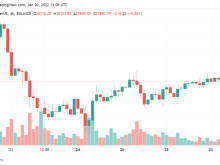
You can see the BTC price here.
Join Bitcoin Magazine Telegram to follow news and comment on this article: https://t.me/coincunews
Disclaimer: This article is for informational purposes only, not investment advice. Investors should research carefully before making a decision. We are not responsible for your investment decisions.
SN_Nour
According to beincrypto