
Technical analysis of Bitcoin on the evening of Tet 1
Bitcoin (BTC) is showing strong bullish signals on the intraday but has yet to break its short-term
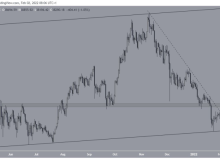
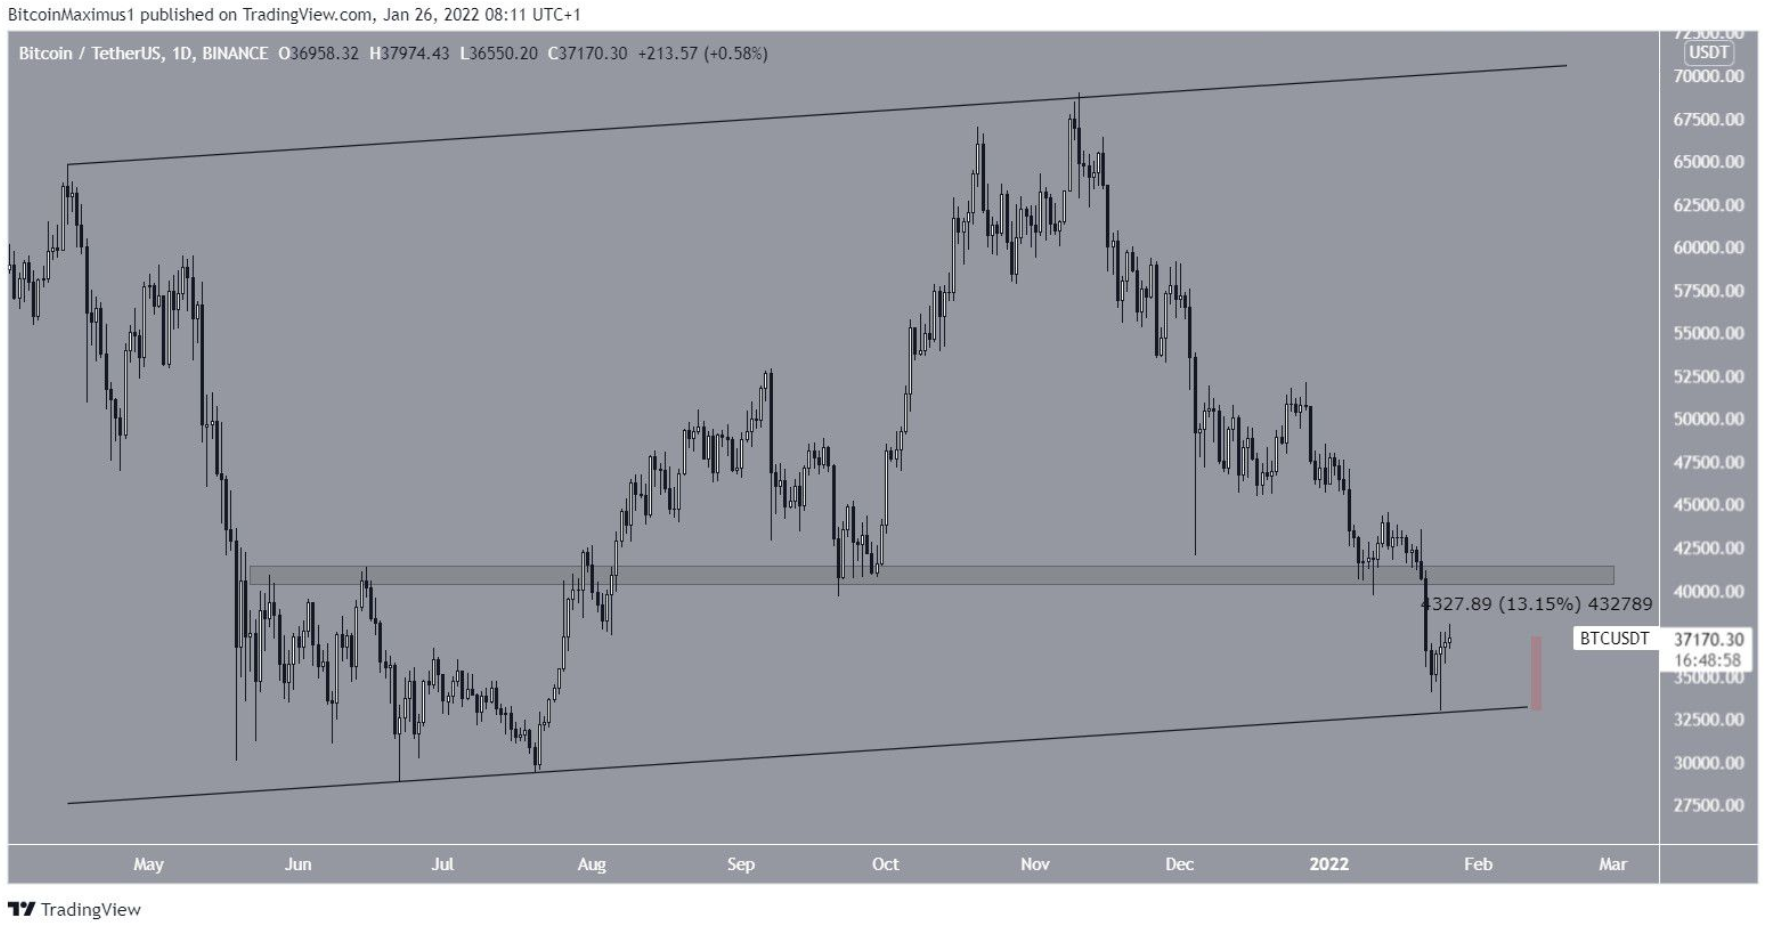
Bitcoin (BTC) has been on the rise since hitting a local low of $33,000 on Jan. 24. It is currently approaching the first critical Fib and horizontal resistance area.
Bitcoin has been trading in an ascending parallel channel since April 2021. It hit a low of $32,917 on January 24, 2022 and recovered. The move was intended to confirm the channel’s support line, and BTC has since rallied 13%.
The main resistance area is located at $40,800. This is an area that previously acted as support until BTC broke below it on Jan. 21. Therefore, this zone is now expected to resist.
BTC/USDT daily chart | Source: TradingView
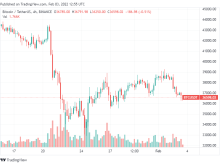
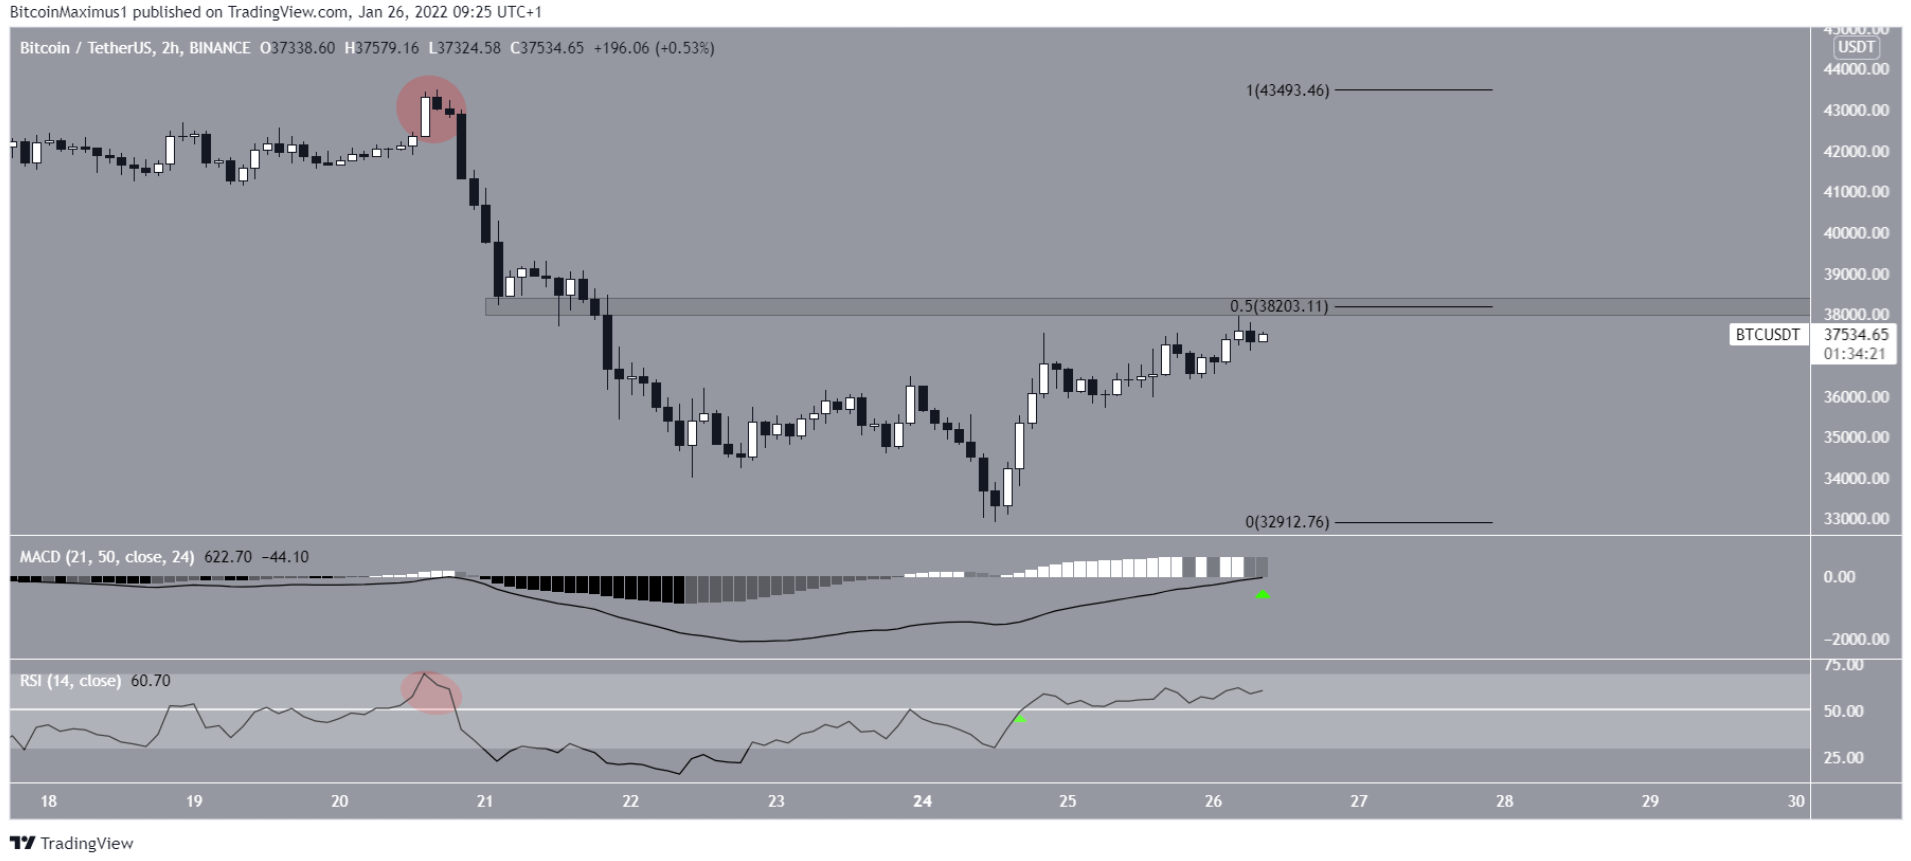
The two-hour chart shows BTC approaching the $38,200 resistance. This is both 0.5 Fib retracement resistance and horizontal resistance area. A break above this would be an important development in creating a bullish structure.
Technical indicators are also giving bullish signals. The RSI, which is a momentum indicator, has moved above the 50 level (green symbol), which suggests that the short-term trend is bullish. Similarly, the MACD is about to break into the positive zone.
However, it remains to be seen if this move above 50 (red circle) is a short-term deviation similar to what happened on January 20th.
A break and close above $38,200 would do much to confirm that the uptrend was more than just a mild rally.
BTC/USDT 2 hour chart | Source: TradingView
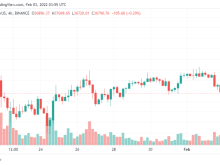
The 15-minute chart shows BTC attempting to move above the $37,400 area, where it previously rejected it twice (red icon).
However, the price is trading within an ascending parallel channel, which is usually a corrective pattern. Movements within the channel also have frequent crossovers, further supporting the possibility of BTC correcting.
Based on these signals, a break below the channel seems the most likely scenario.
Despite this potential short-term drop, the long-term wave number suggests that BTC has bottomed.
BTC/USDT 15-minute frame | Source: TradingView
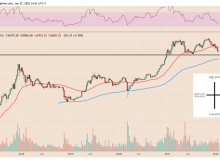
You can see the BTC price here.
Join Bitcoin Magazine Telegram to follow news and comment on this article: https://t.me/coincunews
Disclaimer: This article is for informational purposes only, not investment advice. Investors should research carefully before making a decision. We are not responsible for your investment decisions.
SN_Nour
According to beincrypto