On-Chain Analysis: MVRV and NUPL show Bitcoin is approaching a bear market
Bitcoin Magazine will cover Bitcoin (BTC) on-chain metrics, more specifically Market Value to Realized Value
Bitcoin Magazine will look at Bitcoin (BTC) on-chain metrics, more specifically the HODL wave, to determine the percentage of coins held by short-term holders.
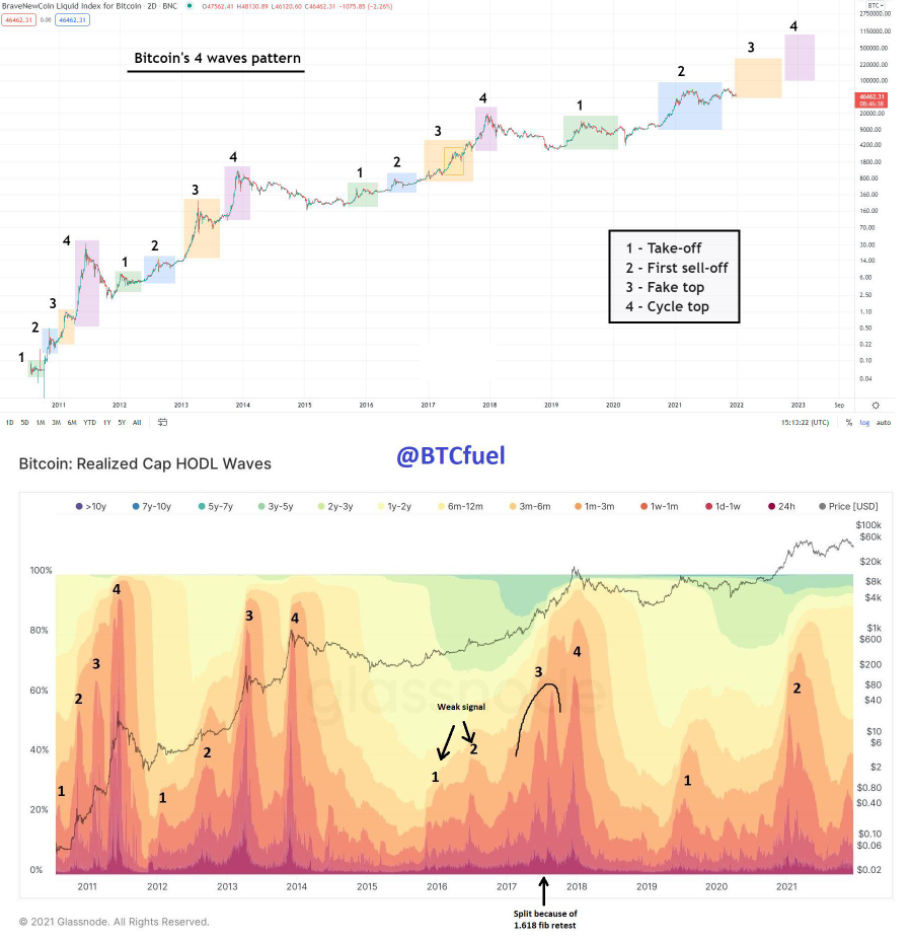
The HODL wave shows the percentage that BTC has moved over a period of time. This is done based on the total supply of BTC. So, if the 1-2 year HODL waveband has an amplitude of 15%, it means that 15% of the total BTC supply was last moved 1-2 years ago.
Analyst @BTCfuel tweeted a chart of the HODL wave. It shows a pattern that has lasted since 2011. The BTC cycle consists of four phases, each with different characteristics.
The source: Twitter
In this article, we will take a detailed look at the HODL Wave indicator and analyze its readings.
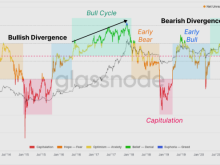
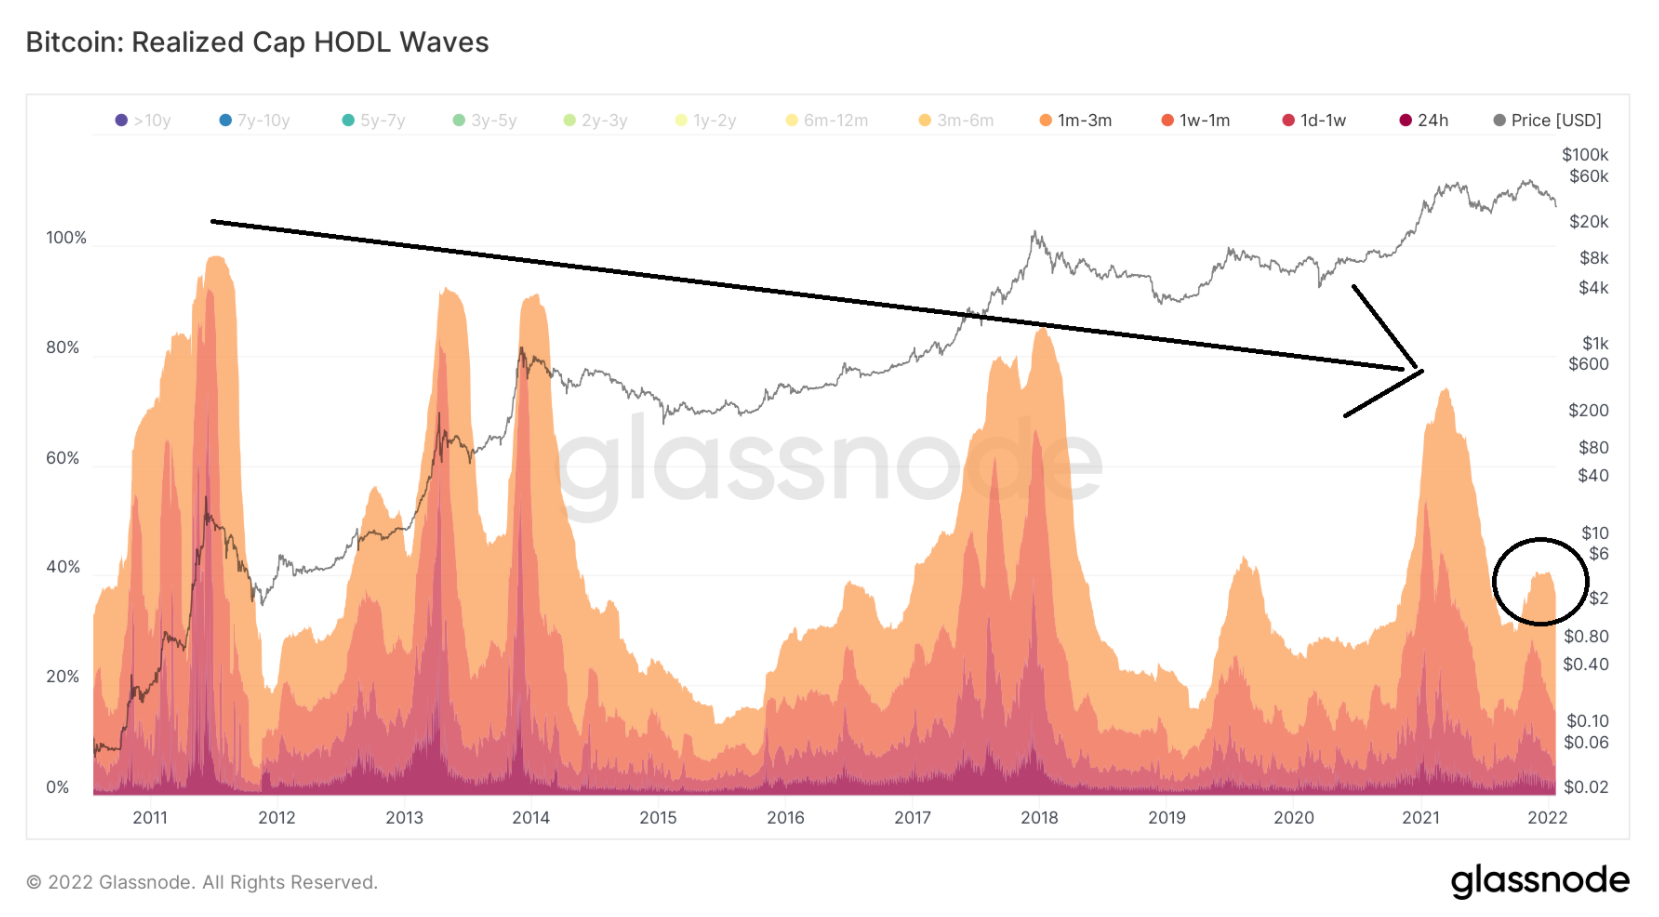
The most remarkable thing about looking at the indicator since 2011 is that the 1-day to 3-month bands increase significantly when the market peaks.
In 2011, these bands peaked at 97%. In 2013-2014, they twice increased by more than 90%. However, in 2017 they are just over 80%, while in 2021 they are barely over 70%.
This means that the majority of BTC supply moved within three months before the market peaked. Most likely, this happened because old hands were selling to new hands during the bullish phase of the market.
Another interesting observation is that the percentage of total supply moving as BTC price nears the top has steadily decreased with each market cycle, from 97% in 2011 to 72% in 2021.
As a result, more and more long-term holders (or lost coins) are not taking profits during the market’s peak, but are holding on.
Finally, the percentage of coins that have moved over the past three months is only 40% (black circle) during BTC’s ATH in November. This is not the same as previous market cycle peaks.
The source: glass node
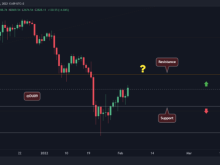
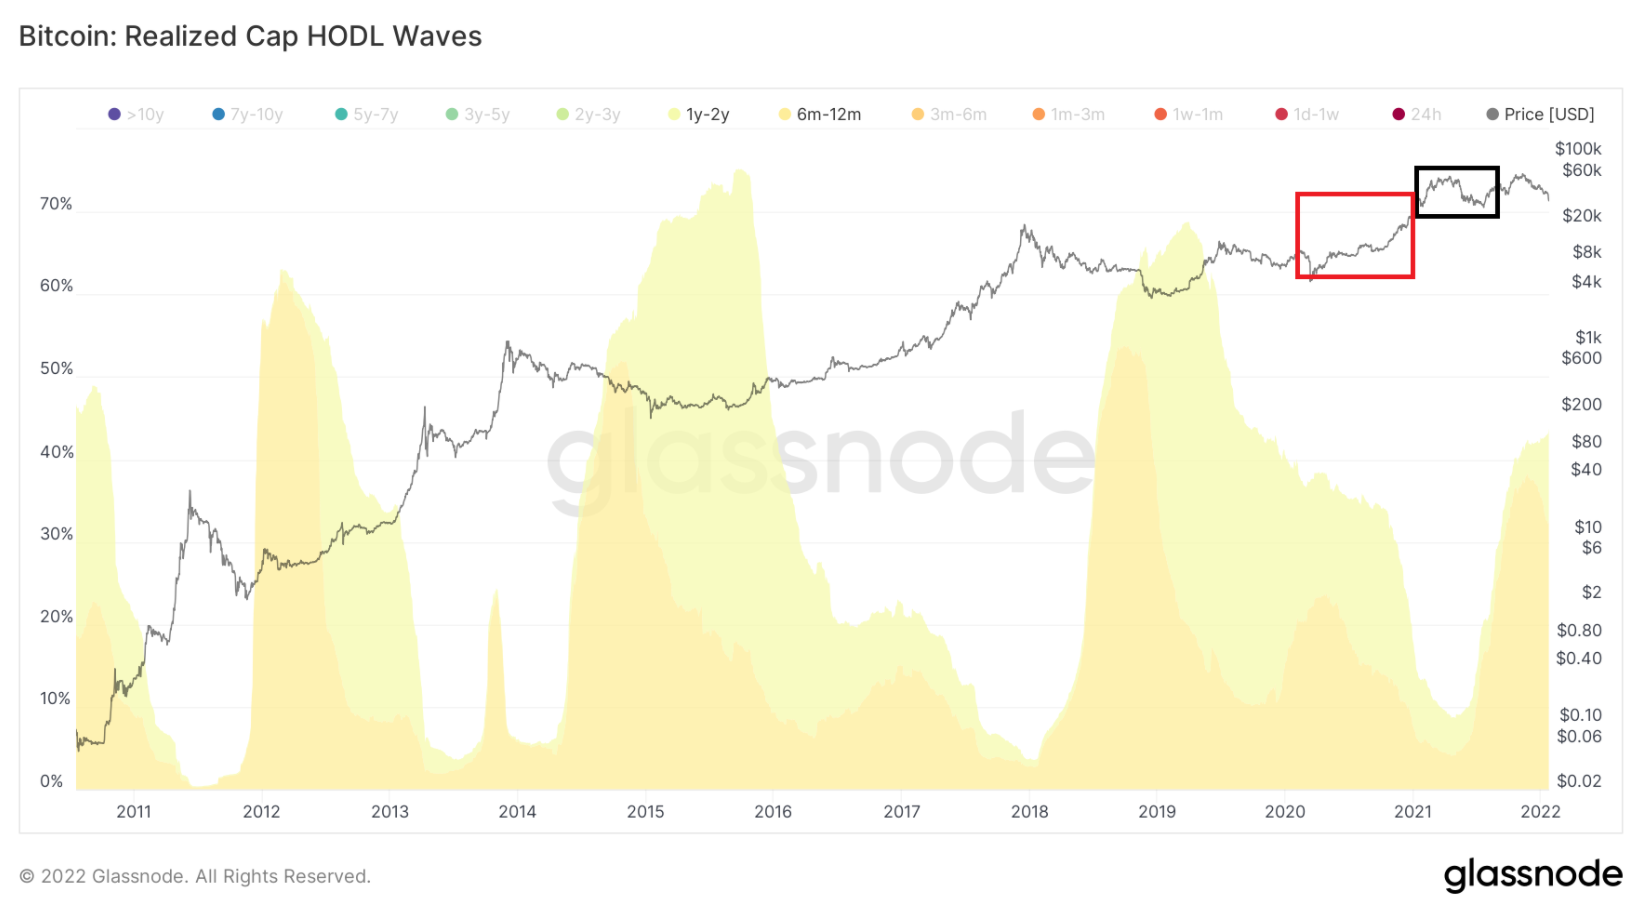
The two bands rising the fastest are the 6-12 month band (yellow) and the 1-2 year band (light yellow). Both are up 5.11% and 4.23%, respectively, since July 2021.
Currently, coins last moved between 6 and 12 months make up 32% of the total supply, while coins last moved 1-2 years ago make up 10% of the total supply.
As a result, 32% of total BTC supply last moved from January to August 2021 when the price fluctuated between $35,000 and $50,000 (black circle). The coins bought during this time have not yet been sold at a loss. This is clearly shown by the fact that the short-term bands are not excessive.
Also, coins that last moved within 1-2 years make up 10% of the total supply. During this time, the price of BTC ranged from $8,000 to $30,000. As a result, these holders are still profitable but have not taken profits during BTC’s run towards all-time highs.
This is a sign that these holders are still confident that BTC will head higher.
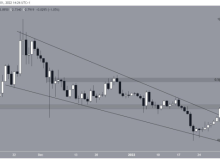
Finally, similar to how short-term bands bulge near market cycle peaks, bulges of 6-24 month bands have historically been associated with periods of accumulation.
After the previous market cycle peaked, the 6-24 month band held over 60% of the total BTC supply. What ensued was a huge bull run, with these holders selling for a profit. This in turn causes a drop in the bands.
The source: glass node
By combining these short-term and long-term bands, we can conclude that the current movement of the short-term and long-term holders resembles an accumulation phase rather than a market cycle top.
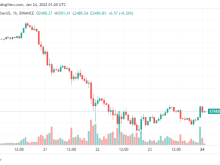
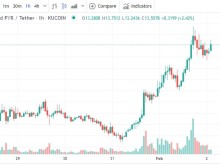
You can see the bitcoin price here.
Join Bitcoin Magazine Telegram to follow news and comment on this article: https://t.me/coincunews
Disclaimer: This article is for informational purposes only, not investment advice. Investors should research carefully before making a decision. We are not responsible for your investment decisions.
SN_Nour
According to beincrypto