
Cryptocurrency Market January 31, 2022: Bitcoin and Ethereum continue to retreat
Crypto Market Jan 31, 2022: Bitcoin price attempted to close above the $38,000 resistance area but failed
Bitcoin (BTC) and most major altcoins are struggling to find a bottom, suggesting traders are selling their positions out of fear. The big question on everyone’s mind is whether the sale is over or can the decline continue?
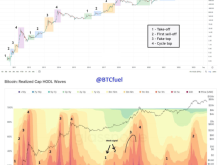
Dylan LeClair, senior analyst at UTXO Management, emphasized that the network’s cost basis, the average price at which Bitcoin was last moved by investors, was $24,000 and that the cost-to-basis ratio has historically dipped below 1.
If history repeats itself, Bitcoin may need to drop a little further to make it an attractive buy for the index.
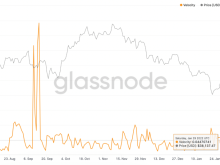
Long-term investors seem unfazed by Bitcoin’s recent correction. Glassnode data shows that investors continue to withdraw their coins in cold wallets.
“The illiquid supply of bitcoin is steadily growing,” said Lex Moskovski, CEO of Moskovski Capital.
Bitcoin and most major atlcoins are approaching a strong support level. Can investors take this opportunity to buy, or will the bears continue to prevail? Let’s study the top 10 cryptocurrencies chart to find out.
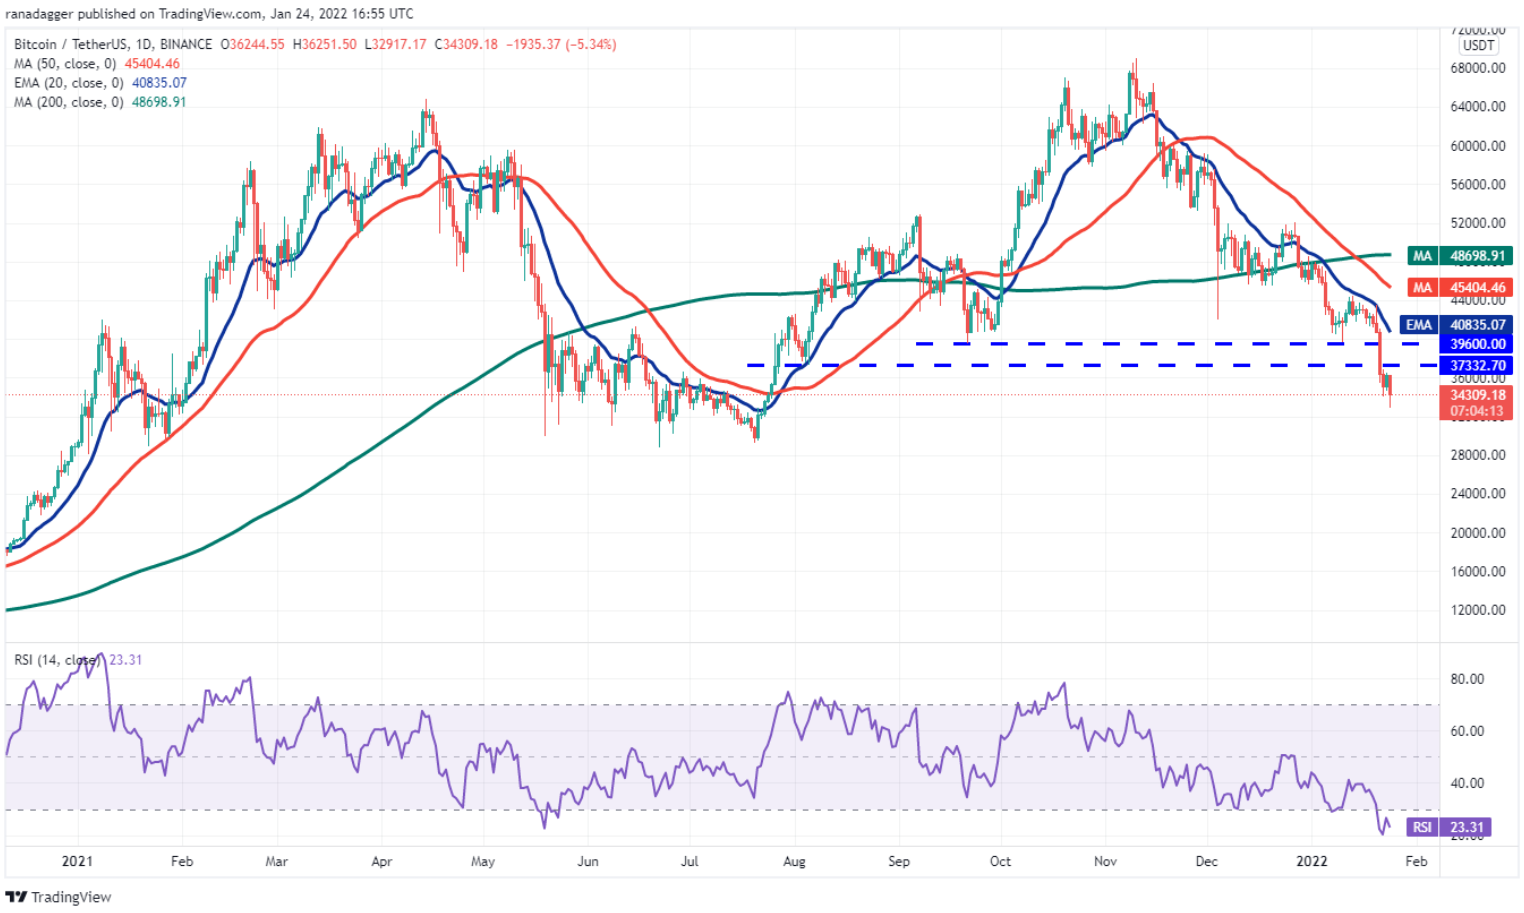
Bitcoin has been trading below the $39,600 – $37,332 zone for the past two days. Buyers attempted a rally on Jan. 23 but failed even to challenge the $37,332 resistance. This points to weak demand at higher levels.
BTC/USDT daily chart | Source: TradingView
The selling pressure continued on Jan. 24 and the bears dragged the BTC/USDT pair below the Jan. 22 low of $34,008. The next support on the downside is the critical price zone of $30,000 – $28,805.
Oversold Relative Strength Index (RSI) levels indicate near-term oversold. This could encourage traders to buy near the support zone. If the price recovers from this zone, the bulls will attempt to push the pair above $39,600.
A break and close above the 20-day EMA ($40,835) will be the first sign that the bears might lose their footing. A trend reversal could be signaled after the price breaks out and sustains above the 50-day SMA ($45,404).
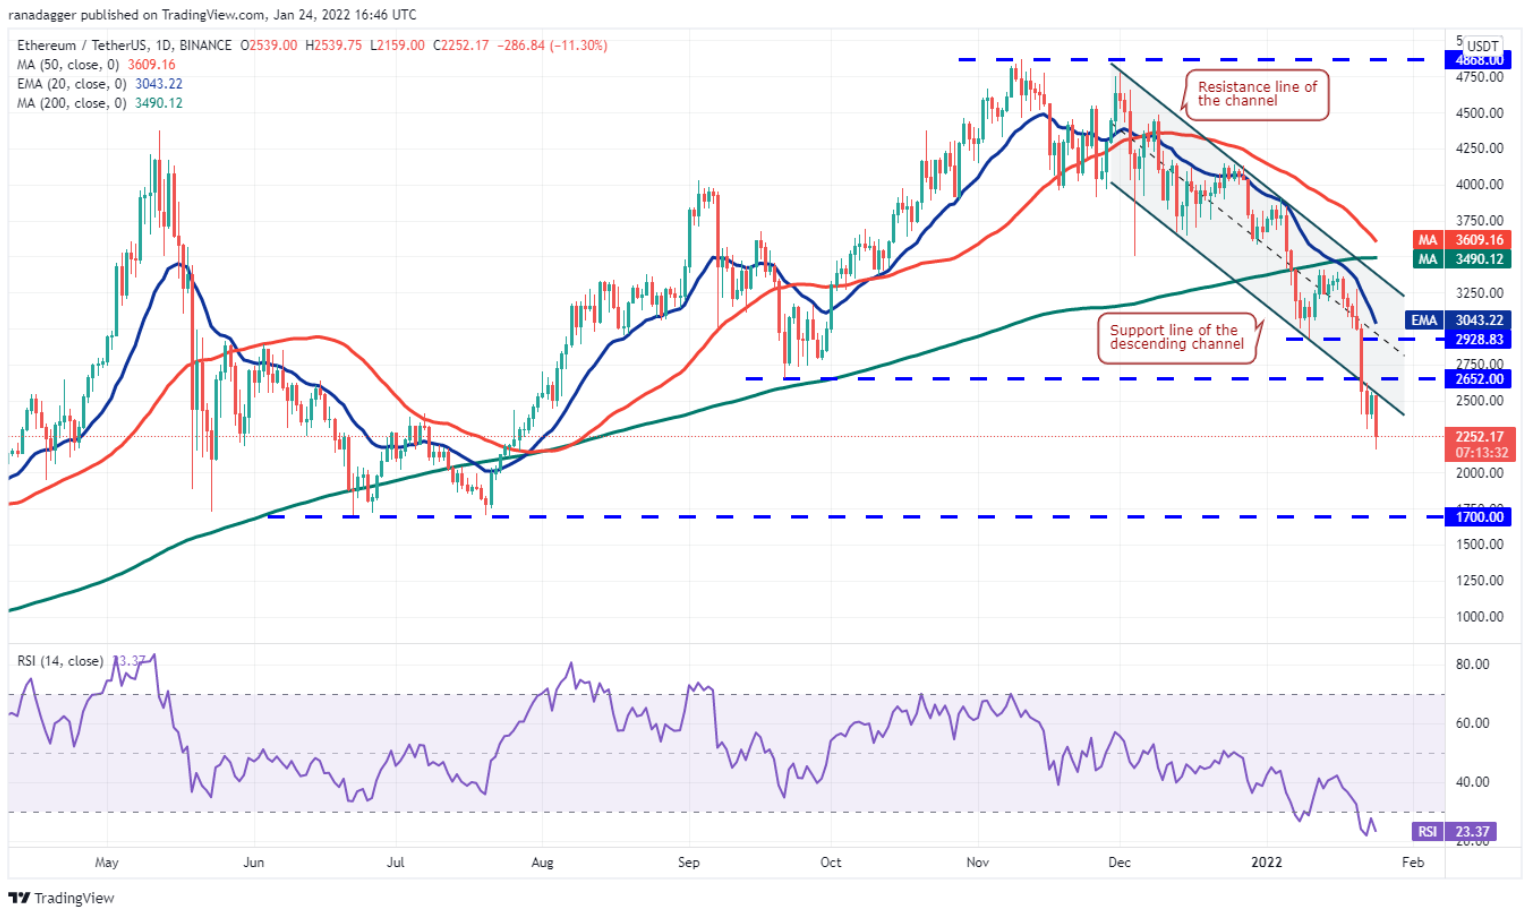
Ether (ETH) plunged and closed below the descending channel on Jan. 21, indicating mounting selling pressures. The bulls attempted to push the price back into the channel on January 23 but failed.
ETH/USDT daily chart | Source: TradingView
This increased selling pressure on Jan. 24 and the bears dragged the price below the Jan. 22 low of $2,300. The ETH/USDT pair can now drop to the psychological $2,000 level where buyers can provide support.
If the price recovers from this level, the bulls will try again to push the price back into the channel. If they succeed, the pair can rally to a breakdown of $2,652. Conversely, if the price falls below $2,000, the pair can slide to the next major support at $1,700.
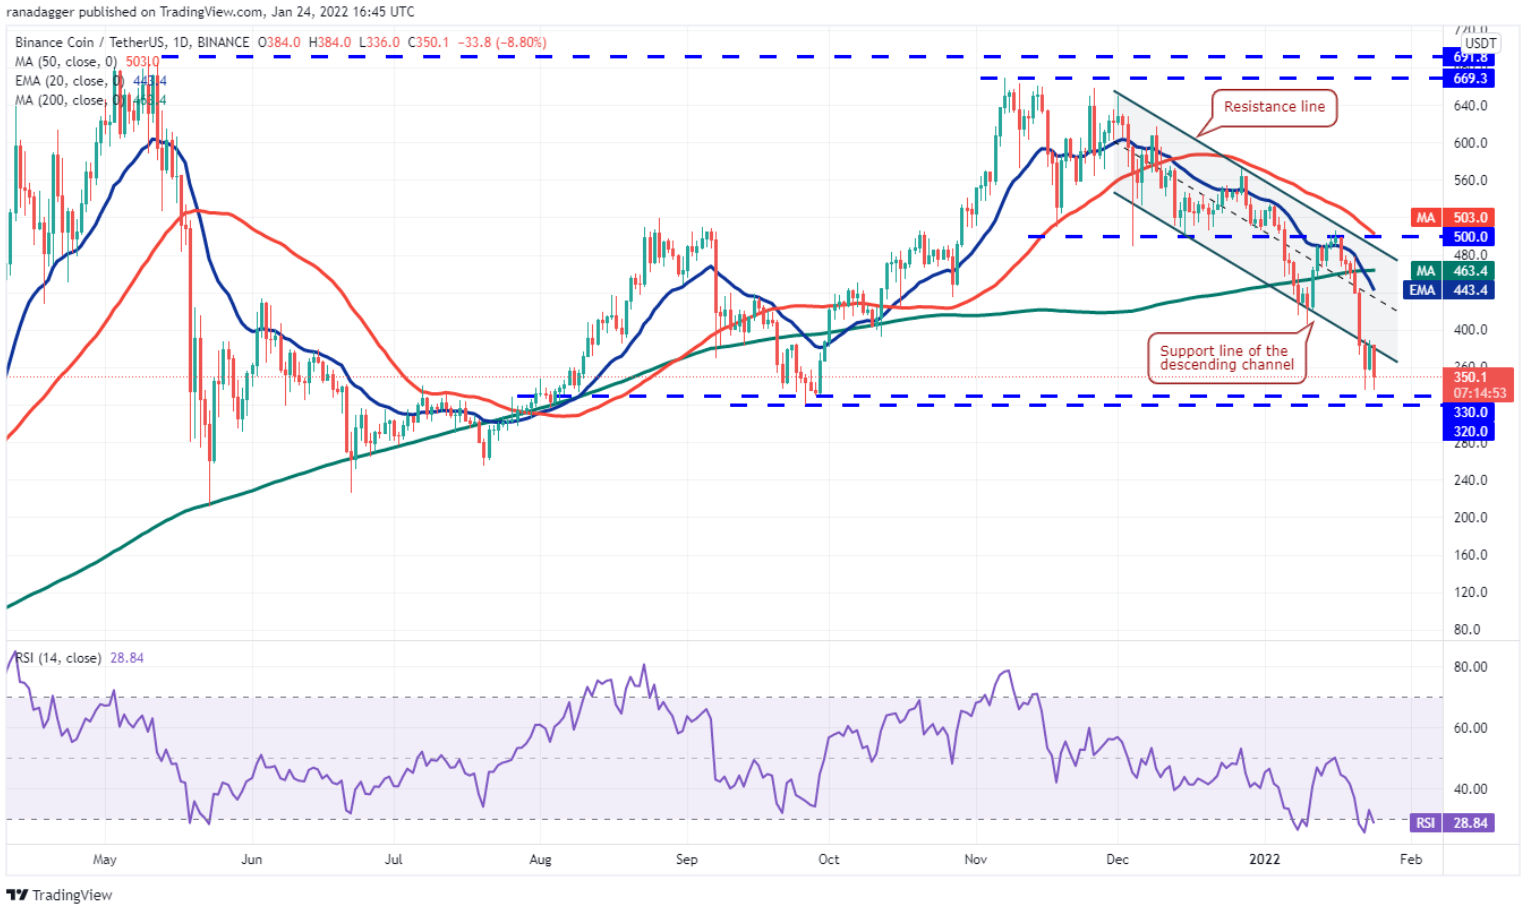
Binance Coin (BNB) tumbled below the descending channel support line on Jan. 21 and the subsequent sell-off on Jan. 22 pulled the price towards the $330-$320 strong support area.
Daily BNB/USDT Chart | Source: TradingView
Buyers attempted to rally on Jan. 23, but the bears failed to let the price re-enter the channel. This shows that the bears are defending the channel’s support line. Selling resumed on Jan 24 and the bears will try to sink the price below the support zone.
If the price stays below $320, the BNB/USDT pair can drop to $254.50 and then to the next support at $225.40. The first sign of strength will be a breakout and a close inside the channel. After that, the pair may attempt a rally to the 20-day EMA ($443).
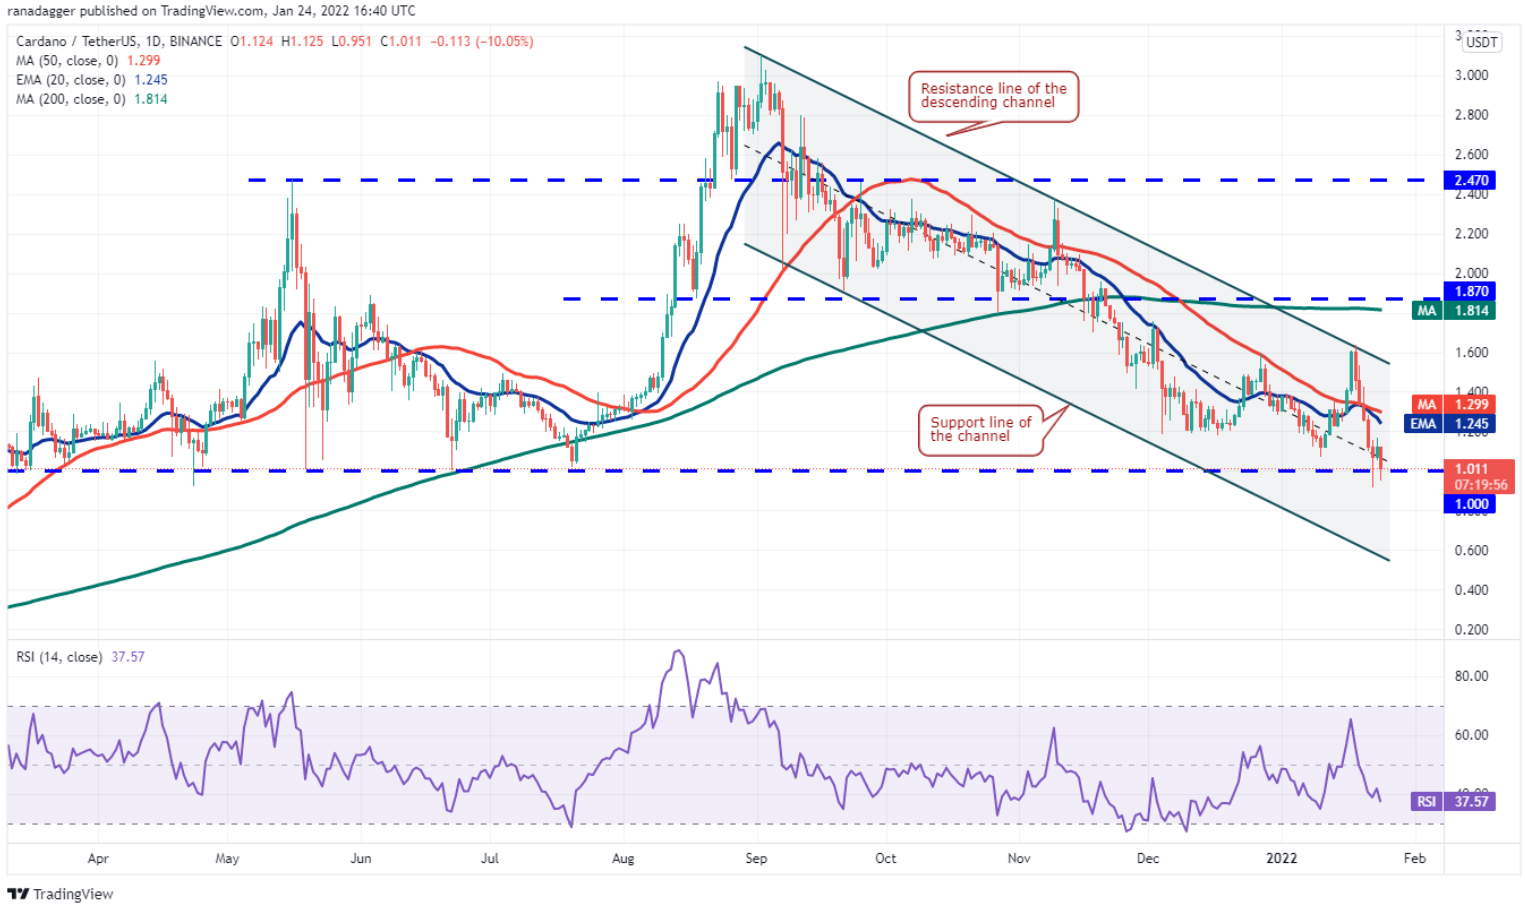
Cardano (ADA) broke below the strong support at $1 on Jan. 22, but the long tail on the candlestick shows that the bulls bought and successfully defended the drop.
Daily ADA/USDT Chart | Source: TradingView
However, on a small downside, the bounce from $1 failed to reach the 20-day EMA ($1.24). This shows that the bears are attacking the slight rallies and not waiting for higher highs to sell.
The bears pulled the price below $1 again on Jan. 24. If they sustain the ADA/USDT pair below this level, selling pressures might intensify. After that, the pair can drop to $0.80 and below the channel support line.
Solana (SOL) fell below the $116 support on Jan 21 and the price touched the descending channel support line on Jan 22 rising higher levels.
Daily SOL/USDT chart | Source: TradingView
The bears resumed selling on Jan 24 and is attempting to sink the SOL/USDT pair below the channel support line. If successful, the selling could gain momentum and the pair could drop to $66 and as low as $58.
Selling over the past few days has pushed the RSI below the 22 level, suggesting that selling has been oversold in the short-term and a rally is possible. The first level to watch on the upside is $116 and then the 20-day EMA ($131).
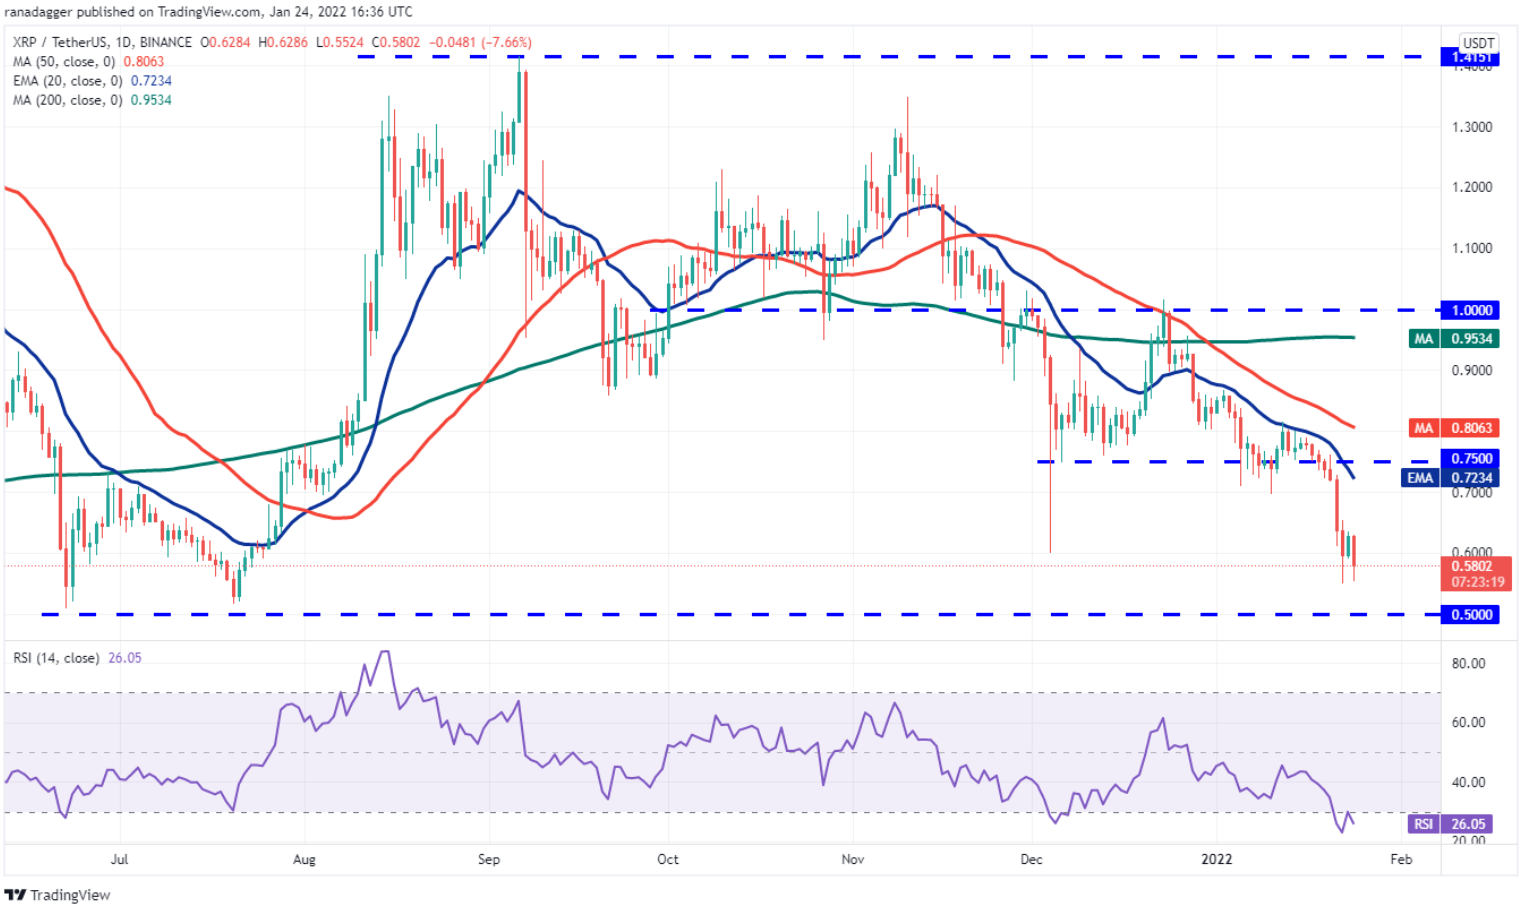
Ripple (XRP) broke below the December 4 low at $0.60 on Jan. 22. The bulls attempted a recovery rally on Jan. 23 but failed to find a bull at higher levels.
XRP/USDT daily chart | Source: TradingView
Selling resumed on Jan 24 and the bears are attempting to drag the price towards the psychological $0.50 level. This is a key support for the bulls to defend because if it breaks, the XRP/USDT pair can drop to $0.39.
Contrary to this assumption, if the price recovers from the $0.50 support, the bulls will attempt to push the pair down to the 20-day EMA ($0.72). A break and close above this resistance could signal that selling pressure is easing.
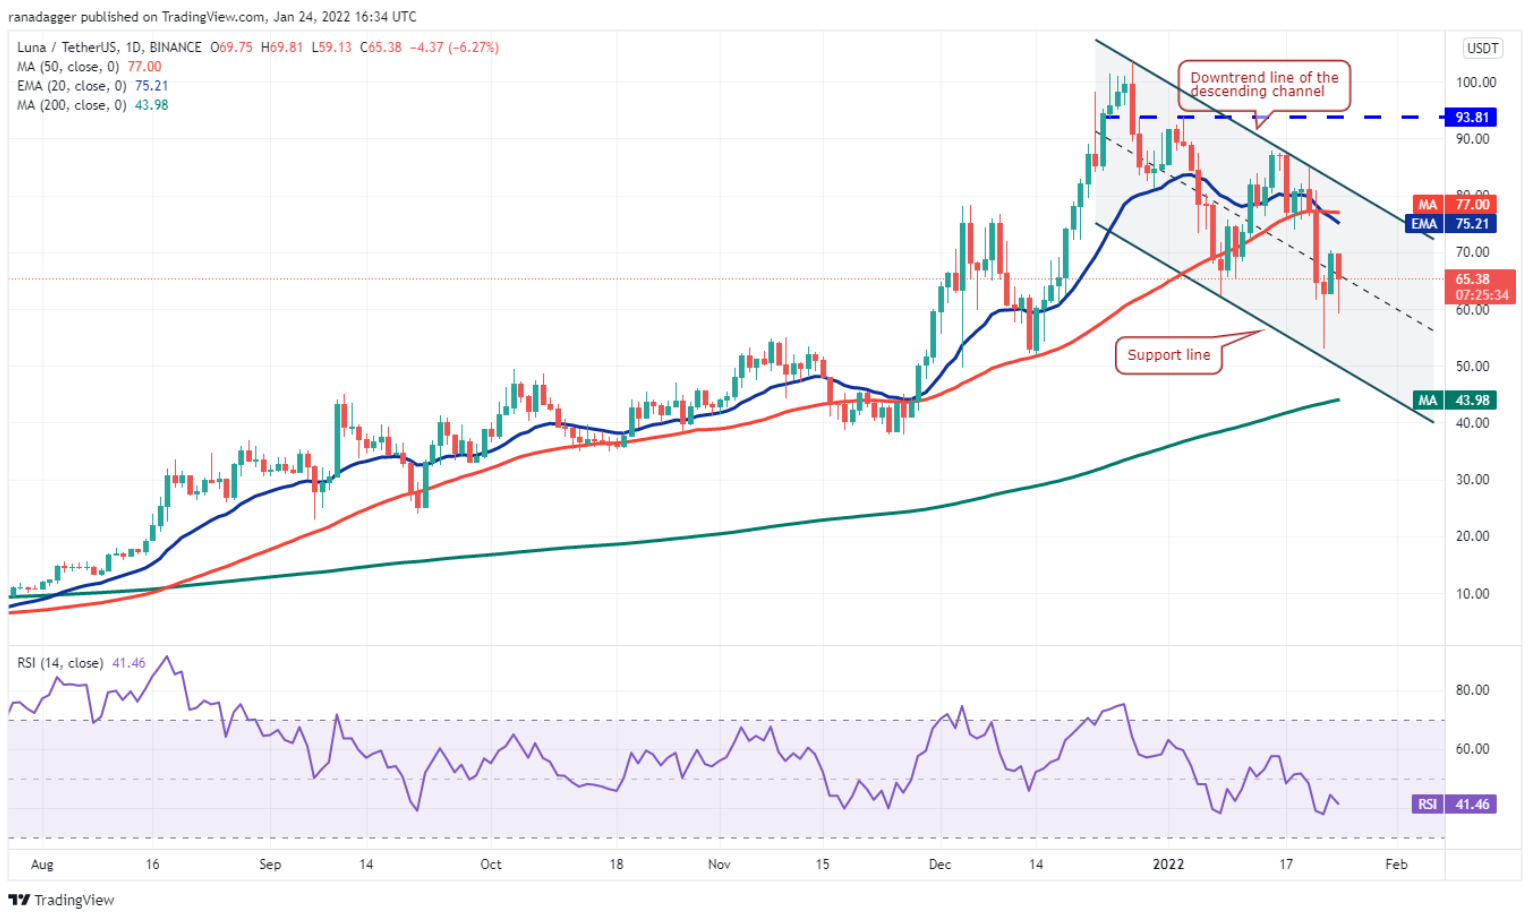
Terra (LUNA) rallied from the descending channel support line on Jan. 22, but the rebound hit a wall on Jan. 23 at $70.22. This shows that the bears are not giving up just yet and are actively selling at higher levels.
Daily LUNA/USDT Chart | Source: TradingView
The moving averages have completed a bearish cross and the RSI is in the negative territory, showing that the bears have the upper hand. Sellers will try to push the price down to the support line.
If the price bounces off this line again, the probability of a return to the downtrend line increases. On the other hand, if the bears sink and sustain the price below the channel, selling pressure could intensify and the pair could drop to $37.82.
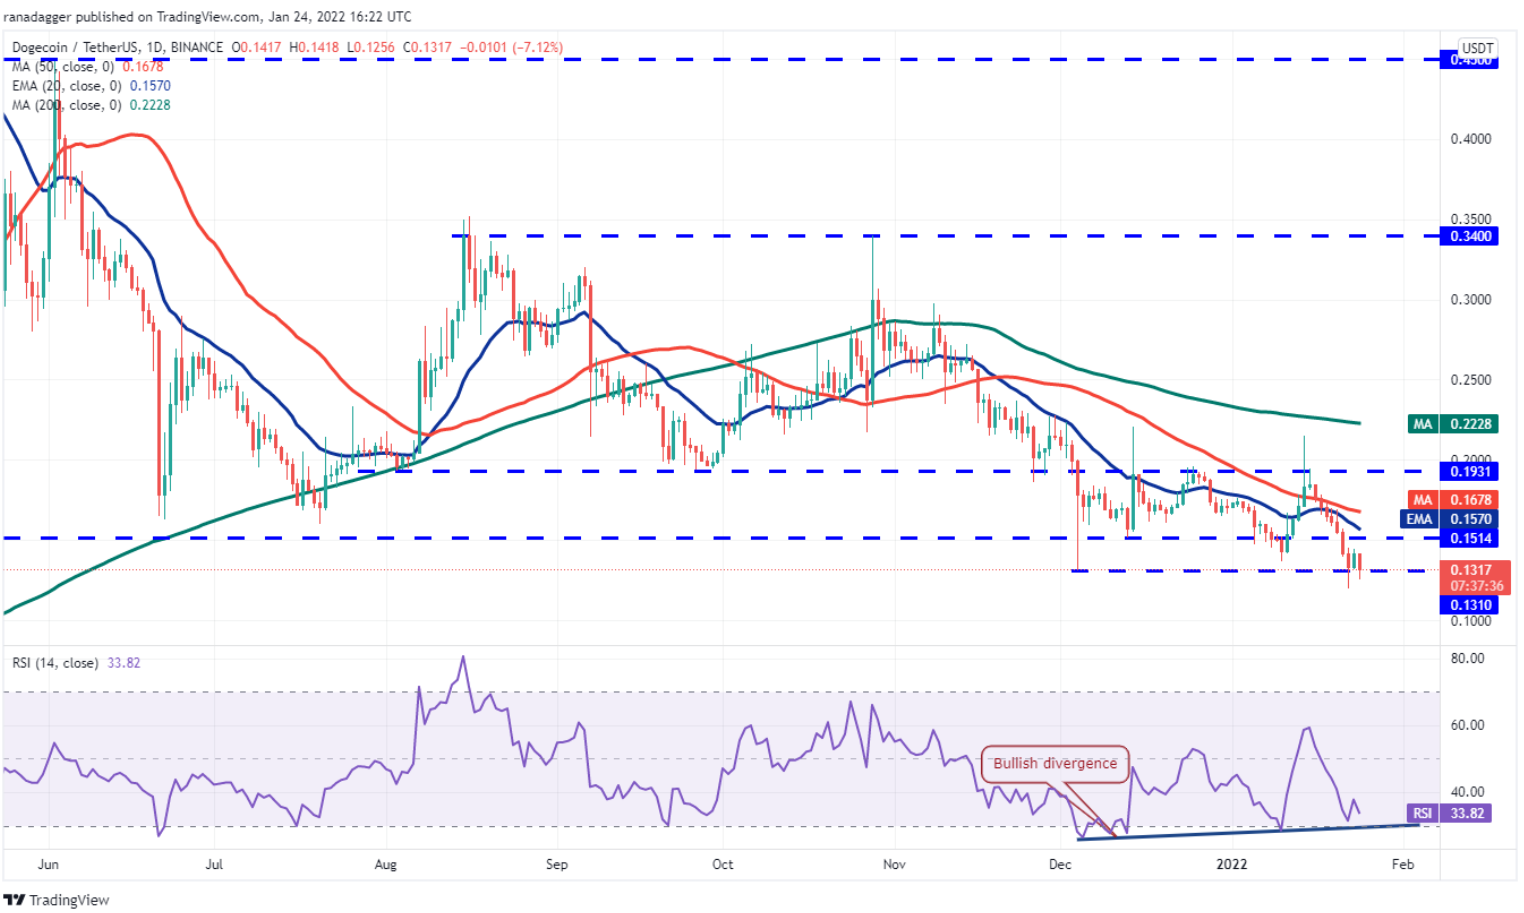
Dogecoin (DOGE) tumbled below the strong support at $0.13 on Jan. 22, but the long tail on the candlestick shows buying at lower levels. Buyers tried to start the recovery on Jan. 23, but higher levels attracted selling.
Daily DOGE/USDT chart | Source: TradingView
The price turned down on Jan 24 and the bears are attempting to sink and sustain the DOGE/USDT pair below the $0.13 support. If successful, the pair can start sliding towards the psychological level at $0.10.
Contrary to this assumption, the bulls will make another attempt to push the pair to the 20-day EMA ($0.15) if the price surges up from the current levels. A break and close above the 50-day SMA ($0.16) can keep the $0.13-$0.19 range in action.
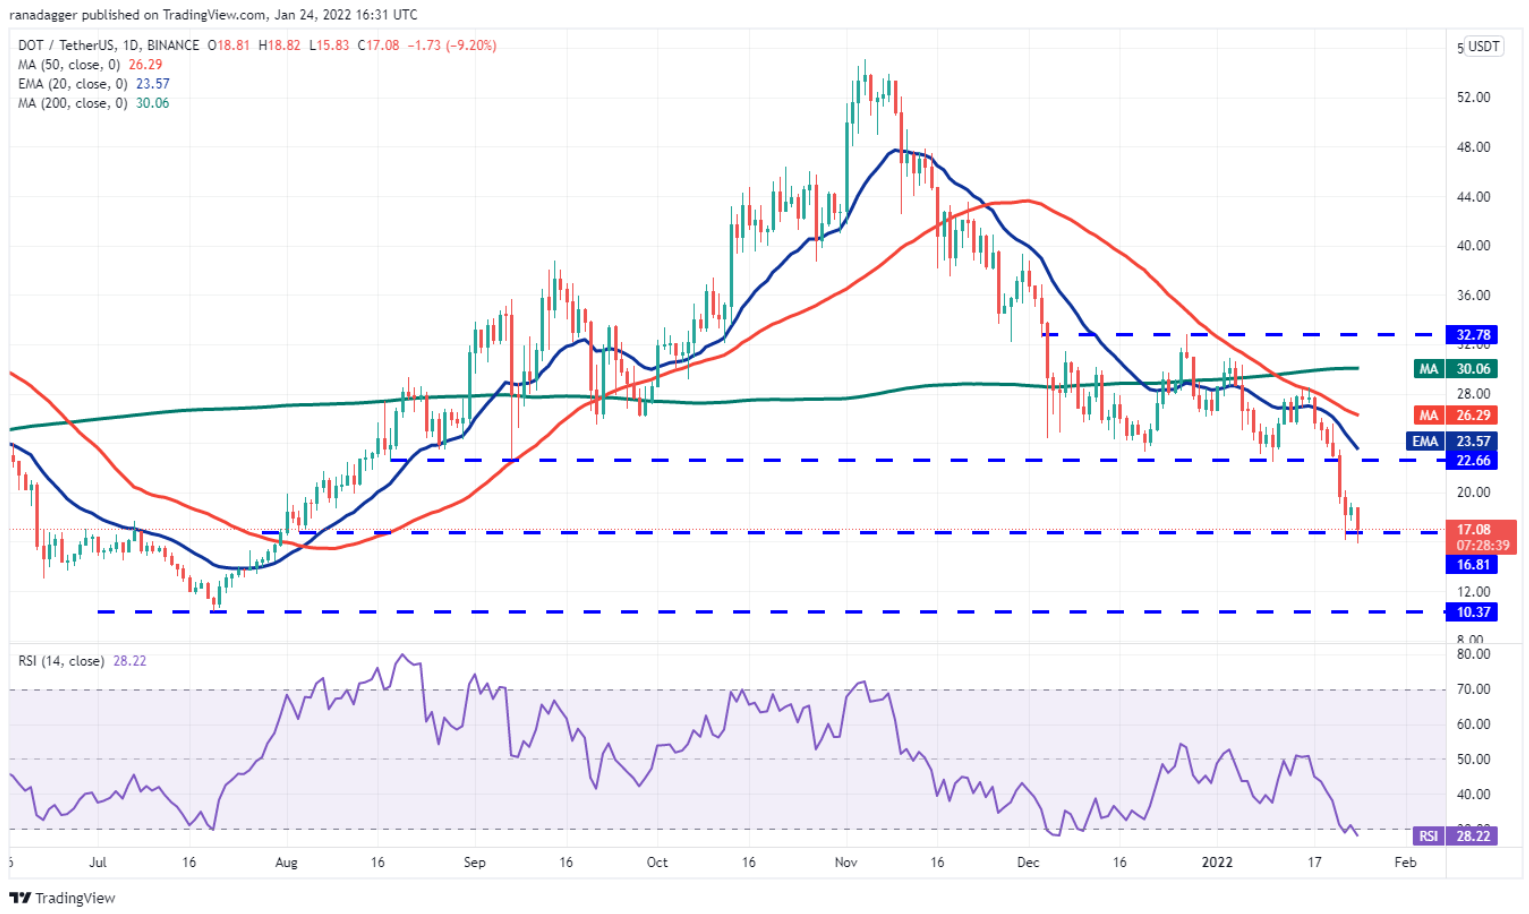
Polkadot (DOT) tumbled below the critical support at $22.66 on Jan 21 and hit the next support at $16.81 on Jan 22. Despite defending their levels, the bulls failed to extend the January 23 rally. This shows a lack of demand for above levels.
DOT/USDT daily chart | Source: TradingView
The bears continued selling on Jan 24, attempting to sustain the DOT/USDT pair below $16.81. If so, the pair can extend its decline to the next major support at $10.37.
The recent heavy selling has pushed the RSI into oversold territory. This suggests that selling is oversold in the near term and a rally is possible.
If the price turns up from the current levels and scales above $19.20, the pair can rally to $22.66.
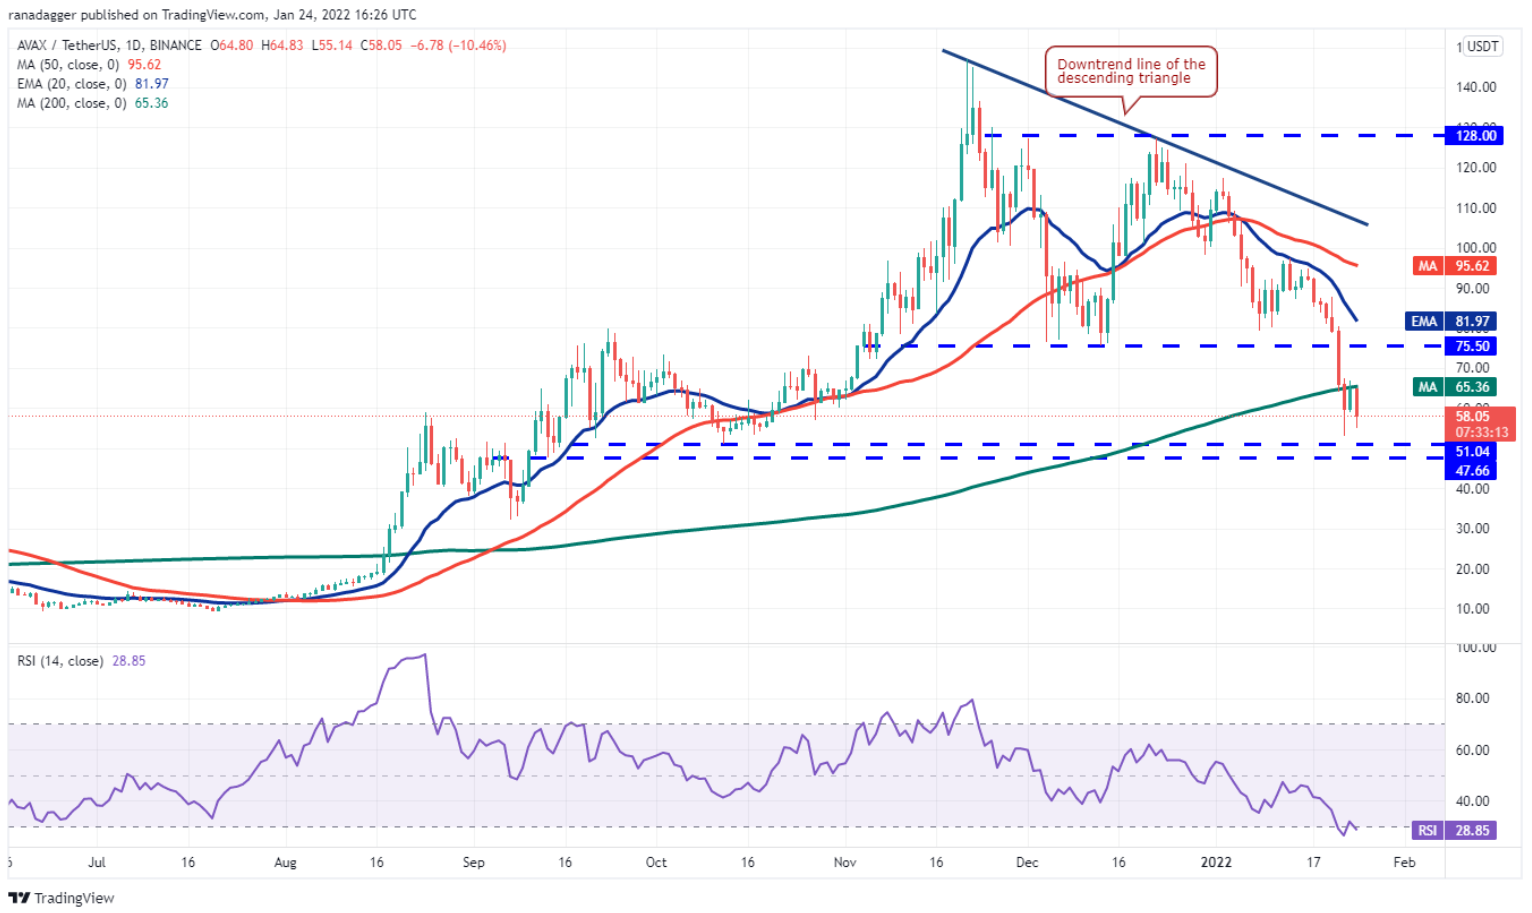
Avalanche (AVAX) turned down and closed below the $75.50 support on Jan 21, completing a descending triangle pattern. The bulls defended the $51.04 support on Jan. 22 but failed to push and sustain the price above the 200-day SMA ($65) on Jan. 23.
AVAX/USDT daily chart | Source: TradingView
This shows strong selling pressure on small rallies. The bears resumed selling on Jan 24 and will attempt to pull the AVAX/USDT pair below the strong $51.04-$47.66 support area. If they succeed, the pair can drop to $32.23.
Conversely, when the price bounces off the support zone, it shows consolidation at lower levels. After that, the bulls will attempt to push the pair to a breakout of $75.50, which should be watched for.
You can see the coin prices here.
Join Bitcoin Magazine Telegram to follow news and comment on this article: https://t.me/coincunews
Disclaimer: This article is for informational purposes only, not investment advice. Investors should research carefully before making a decision. We are not responsible for your investment decisions.
SN_Nour
According to Cointelegraph