
Bitcoin Technical Analysis January 27th
Bitcoin (BTC) has recovered to $38,919 since falling below this zone on Jan. 21. The price has since
For the past few weeks, the crypto market has plummeted on macro-level fears. In this analysis, we will take a closer look at the bitcoin price from an on-chain options market technical perspective and discuss possible short- and medium-term scenarios.
long-term analysis
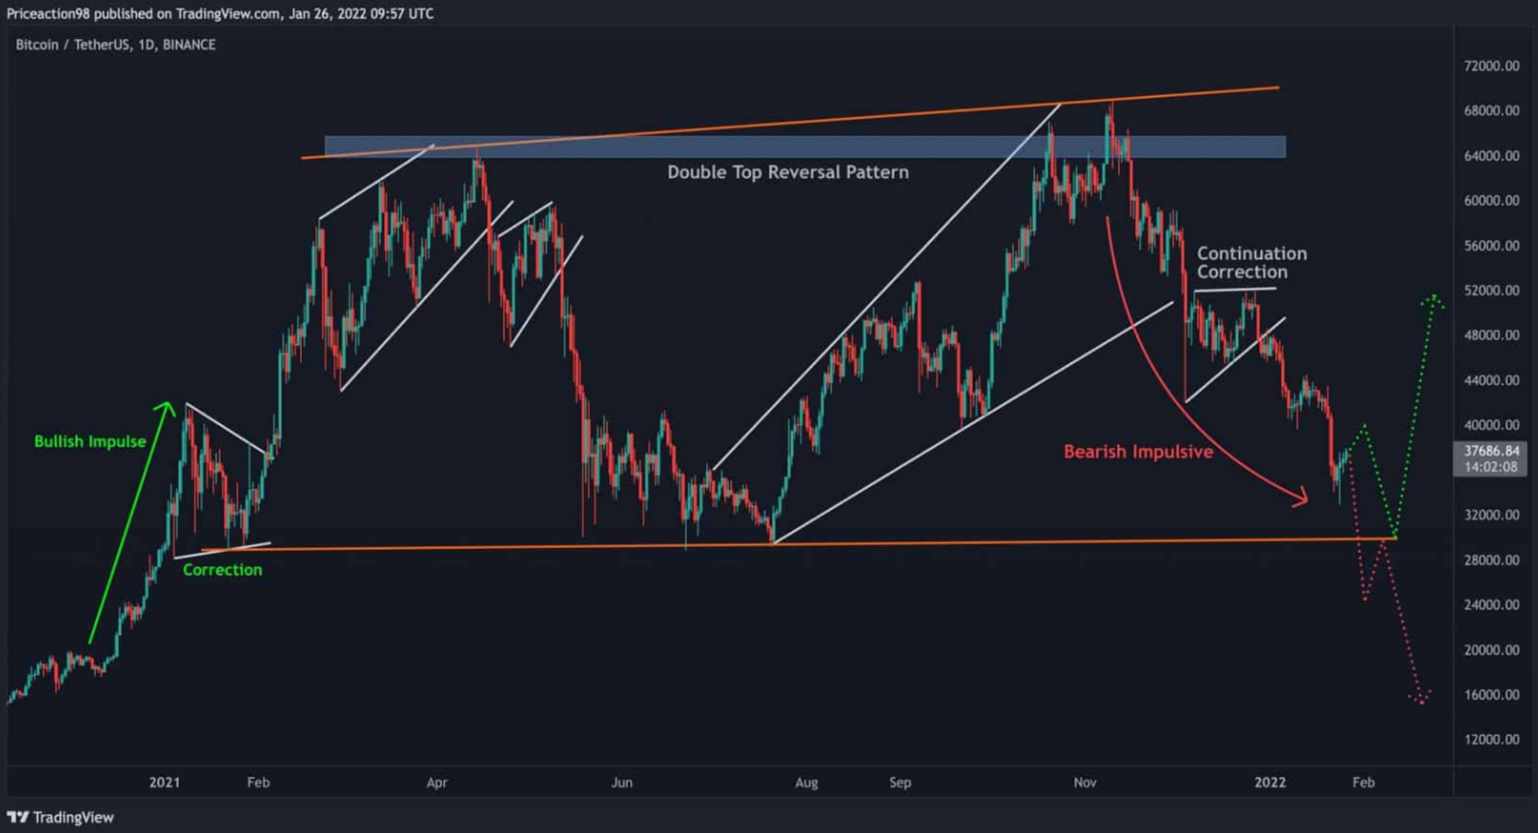
We can observe how the price naturally develops into a larger corrective structure after the initial bullish correction. A few lower highs and lows were made that help identify a corrective structure.
Broadly speaking, from the all-time high (November 10, 2021), BTC price has created a double top, an ascending channel and a head and shoulders pattern, bringing us a selling confluence.
BTC/USDT daily chart | Source: TradingView
Since November, BTC price has been in a downtrend, with multiple corrections on smaller timeframes. The correction may continue as BTC has yet to drop to its previous low to complete the entire pattern.
It is important to wait and see if a positive price action reversal forms until the price hits the bottom range (denoted by the orange line in the chart above). These confirmations are crucial in determining whether BTC can restart another bull run.
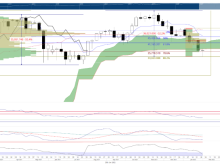
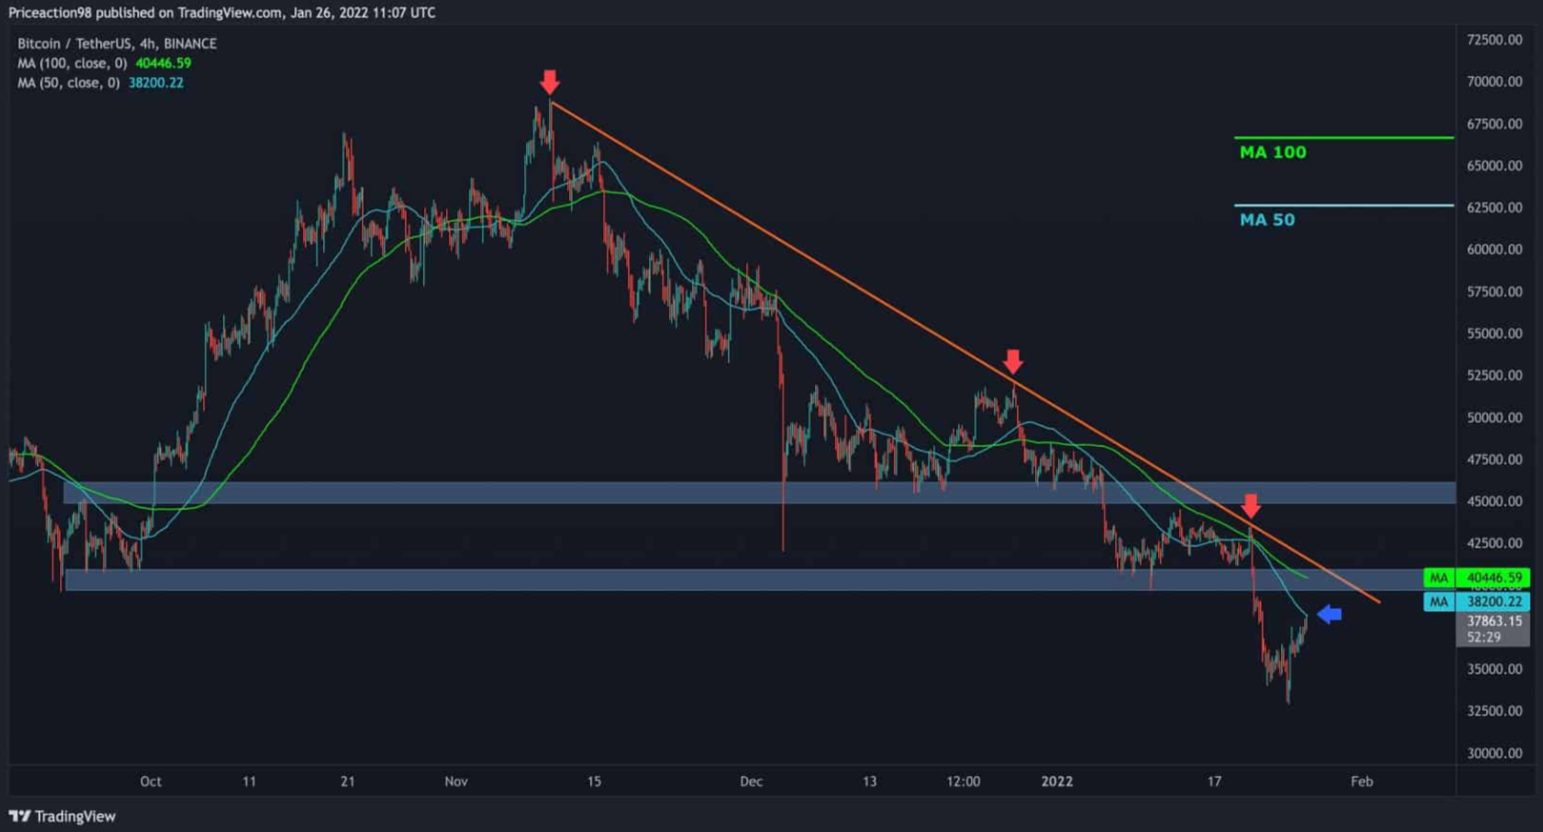
As shown in the 4-hour timeframe chart, the price is in a clear downtrend that started since BTC hit ATH at $69,000.
The descending resistance line (orange) has proved to be a significant resistance for the price. Currently, BTC has many strong resistance levels on its way back into the $40,000-$50,000 range, so it needs to make a higher high to suggest a new rally.
In case the bears push the price lower, the next support is the $30,000 area.
BTC/USDT 4 hour chart | Source: TradingView
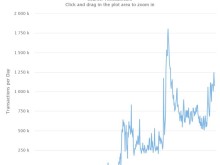
One of the key metrics pointing to a bearish move in the fourth quarter of 2021 is the increase in FX reserves for derivatives.
Symmetrically, FX spot reserves are depleted over the long term, and this inconsistency suggests that many investors bought during the pullback and immediately pulled them off the exchanges. So, it is clear that BTC is in an accumulation phase and trending higher in the medium to long term.
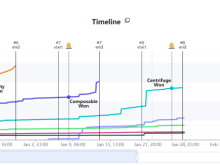
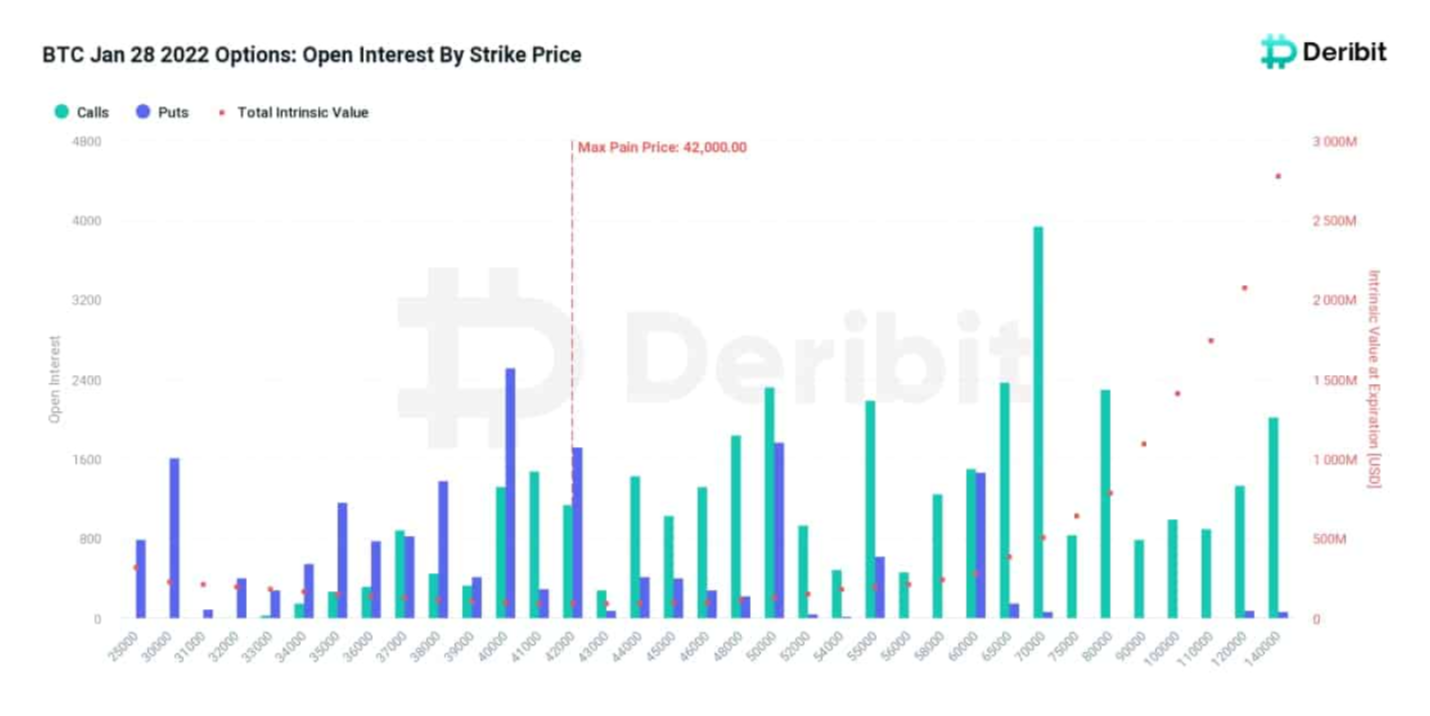
This Friday, Jan. 28, Deribit has approximately $2.1 billion worth of Bitcoin options contracts expiring. This is the most important deadline this month.
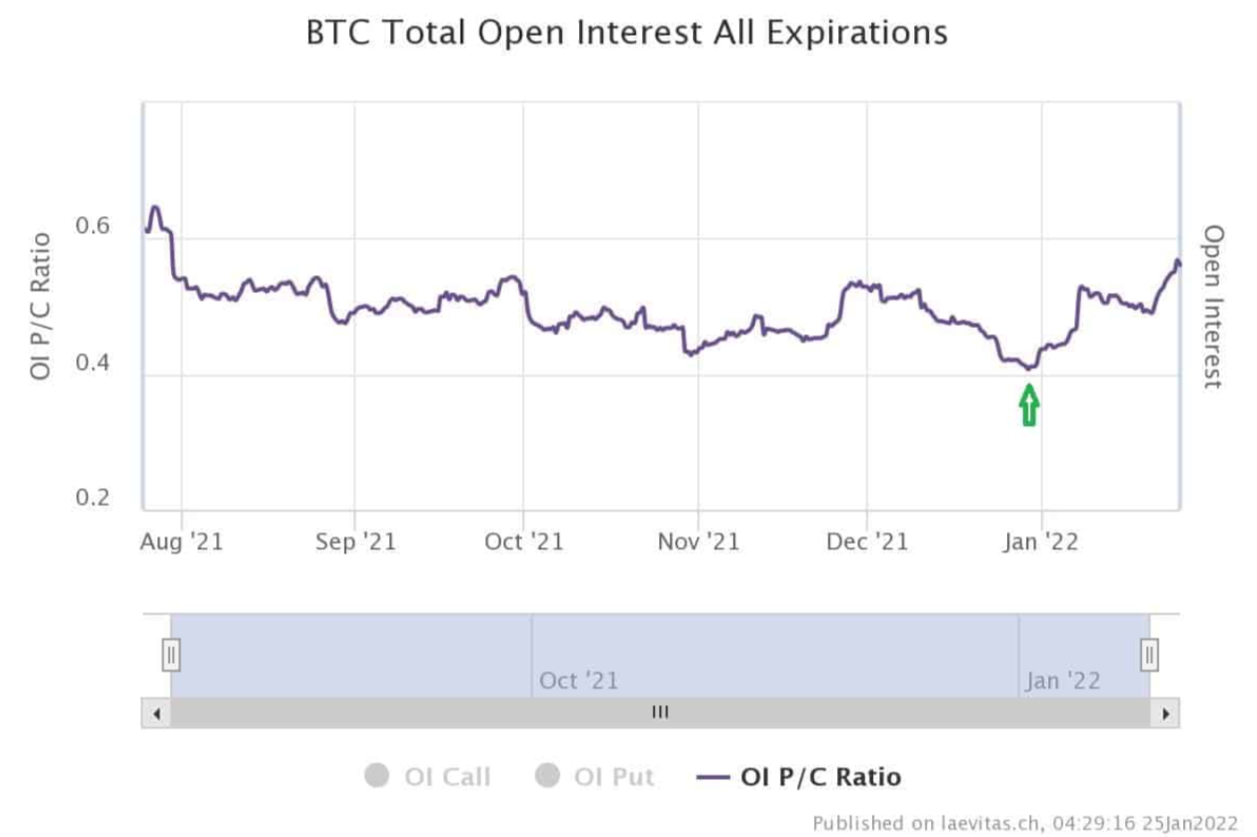
The “max drawdown” – the price that offers the option buyer the maximum loss – is $42,000, and the put/call ratio is 0.5. After the extreme fear in the market and the sell-off on the spot floor, options traders sold call (call) and buy-put (put) options to hedge against a sudden price drop. The put/call ratio has been rising since January, indicating bearish sentiment in the options market.
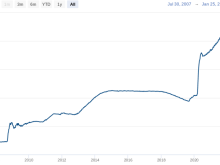
You can see the bitcoin price here.
Join Bitcoin Magazine Telegram to follow news and comment on this article: https://t.me/coincunews
Disclaimer: This article is for informational purposes only, not investment advice. Investors should research carefully before making a decision. We are not responsible for your investment decisions.
SN_Nour
According to Cryptopotato