MIDDLE EAST WAR DRIVES GLOBAL SUPPLY CHAIN PRESSURES TO A THREE-YEAR HIGH: GEP GLOBAL SUPPLY CHAIN VOLATILITY INDEX
Supply shocks drive manufacturers' stockpiling, push shortages to a three-year high and transport costs to a
Loading...
 |
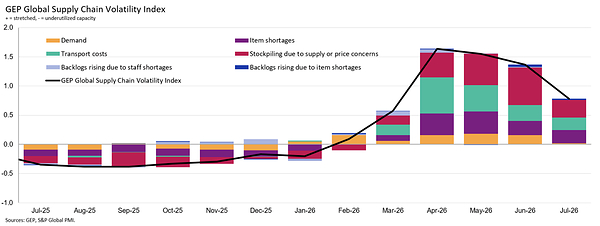
CLARK, N.J., Aug. 12, 2026 /PRNewswire/ -- GEP Global Supply Chain Volatility Index — a leading indicator tracking demand conditions, shortages, transportation costs, inventories and backlogs, based on a monthly survey of 27,000 businesses — showed global supply chain pressures eased in July as manufacturers reduced precautionary stockpiling and transportation pressures moderated. However, supply shortages remained elevated and production backlogs continued to build, indicating supply chains had yet to fully recover before the renewed disruption in the Strait of Hormuz.
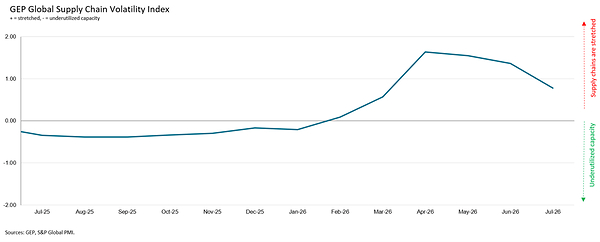
The survey was mostly conducted before the latest escalation in the Middle East and renewed disruption to shipping through the Strait of Hormuz, providing a snapshot of global supply chains immediately before energy prices and geopolitical uncertainty increased again.
Manufacturers scaled back safety-stock building in July following a three-and-a-half-year peak in the second quarter of 2026, suggesting businesses believed supply risks were beginning to ease. Transportation costs also moderated, helping drive the overall improvement in global supply chain conditions.
Despite the easing, reports of critical items in short supply remained elevated globally, while manufacturers continued reporting rising production backlogs caused by missing materials and components. This indicates supply bottlenecks remain unresolved and could worsen if geopolitical tensions persist.
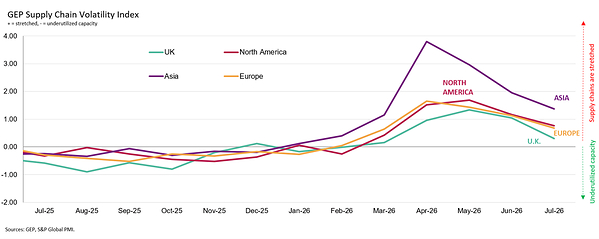
Demand for raw materials and commodities remained strongest across Asia and North America, where manufacturers continued purchasing inputs at a significantly faster pace than other major regions. Europe, by contrast, remained comparatively subdued, reflecting weaker manufacturing order books and lower inventory building.
Interpreting the dаta:
Index > 0, supply chain capacity is being stretched. The further above 0, the more stretched supply chains are.
Index < 0, supply chain capacity is being underutilized. The further below 0, the more underutilized supply chains are.
JULY 2026 REGIONAL KEY FINDINGS
JULY 2026 KEY FINDINGS
For more information, visit www.gep.com/volatility.
Note: Full historical data dating back to January 2005 is available for subscription. Please contact [email protected].
The next release of the GEP Global Supply Chain Volatility Index will be 8 a.m. ET, Sep. 11, 2026.
About the GEP Global Supply Chain Volatility Index
The GEP Global Supply Chain Volatility Index is produced by S&P Global and GEP. It is derived from S&P Global's PMI® surveys, sent to companies in over 40 countries, totaling around 27,000 companies. The headline figure is a weighted sum of six sub-indices derived from PMI data, PMI Comments Trackers and PMI Commodity Price & Supply Indicators compiled by S&P Global.
A Supply Chain Volatility Index is also published at a regional level for Europe, Asia, North America and the U.K. For more information about the methodology, click here.
Media Contacts
Derek Creevey
Director, Public Relations
GEP
Phone: +1 646-276-4579
Email: [email protected]
Joe Hayes
Senior Principal Economist
S&P Global Market Intelligence
Phone: +44-1344-328-099
Email: [email protected]
S&P Global Market Intelligence
Corporate Communications
Email: [email protected]